Date: Fri, Oct 31, 2025 | 11:40 AM GMT
The cryptocurrency market is experiencing high volatility today, with both Bitcoin (BTC) and Ethereum (ETH) trading in the red. The decline has triggered nearly $868 million in total liquidations, out of which $747 million came from long positions.
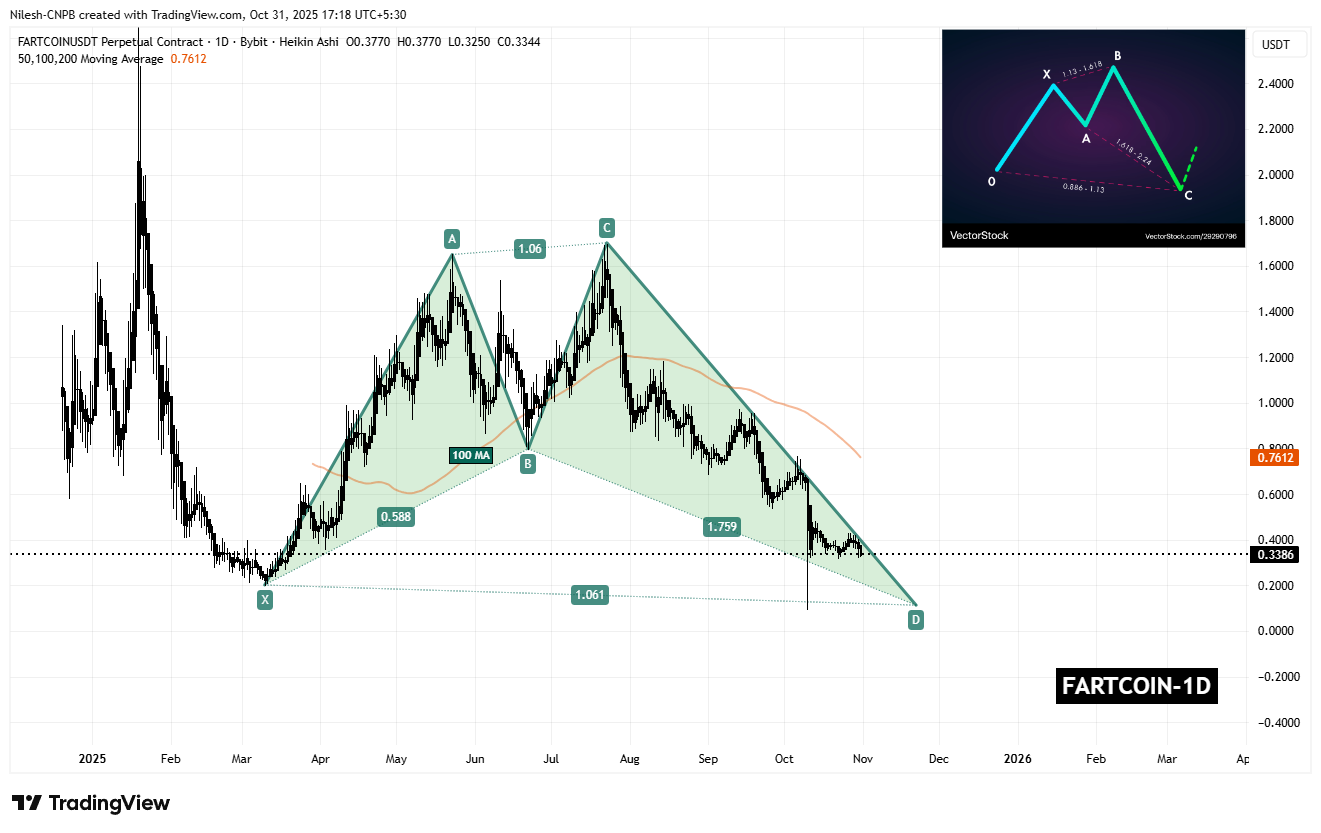
Following this broad sell-off, major memecoins have also seen steep declines — including Fartcoin (FARTCOIN), which is down 6% today, extending its monthly loss to 47%. However, the chart is now highlighting a potential harmonic setup, suggesting the token could face a bit more downside before staging a meaningful rebound.
 FARTCOIN Daily Chart/Coinsprobe (Source: Tradingview)
Bullish Shark Pattern in Play?
On the daily chart, FARTCOIN appears to be completing a Bullish Shark harmonic pattern — a structure often seen near the end of extended downtrends before a rebound begins.
The move began from Point X near $0.1987, followed by an upswing to Point A around $1.06, then a correction to Point B near $0.58, and another sharp rally toward Point C around $1.76. Since then, the price has entered its final leg (CD), currently trading near $0.3386, indicating that the token is approaching its Potential Reversal Zone (PRZ).
 FARTCOIN Daily Chart/Coinsprobe (Source: Tradingview)
What’s Next for FARTCOIN?
For now, sellers remain dominant, with FARTCOIN trading well below its 100-day moving average (MA) near $0.76. The token is also facing trendline resistance along the descending channel drawn from the August highs.
If the bearish momentum continues, one more corrective leg toward the $0.10–$0.20 zone could complete the Shark pattern, marking the potential end of the current downtrend. A bounce from this region could signal the start of a strong bullish reversal.
However, for bulls to regain control, a decisive move above $0.43 resistance zone and breakout above the 100-day MA will be crucial. Such a move could confirm the bullish reversal and open the path toward the $0.95–$1.10 area over the coming weeks.