Date: Mon, Nov 03, 2025 | 09:00 AM GMT
The cryptocurrency market is experiencing its typical Monday volatility, giving back most of its weekend gains as both Bitcoin (BTC) and Ethereum (ETH) trade in red — down about 2% and 4%, respectively. This weakness has added noticeable pressure on major altcoins , including Sui (SUI).
SUI has slipped more than 6% today, and more importantly, it’s now hovering near a critical support zone that could define its next short-term move — whether a rebound or deeper correction.
 Source: Coinmarketcap
Falling Wedge Pattern in Play
On the 4-hour chart, SUI is shaping a falling wedge pattern — a classic bullish reversal formation that often indicates the end of a downtrend.
As shown in the chart, the token has steadily declined within converging trendlines since late October, and the recent pullback brought SUI right down to the wedge’s lower boundary, near $2.20. This level has repeatedly attracted buying pressure in recent sessions, suggesting that bulls are actively defending the zone.
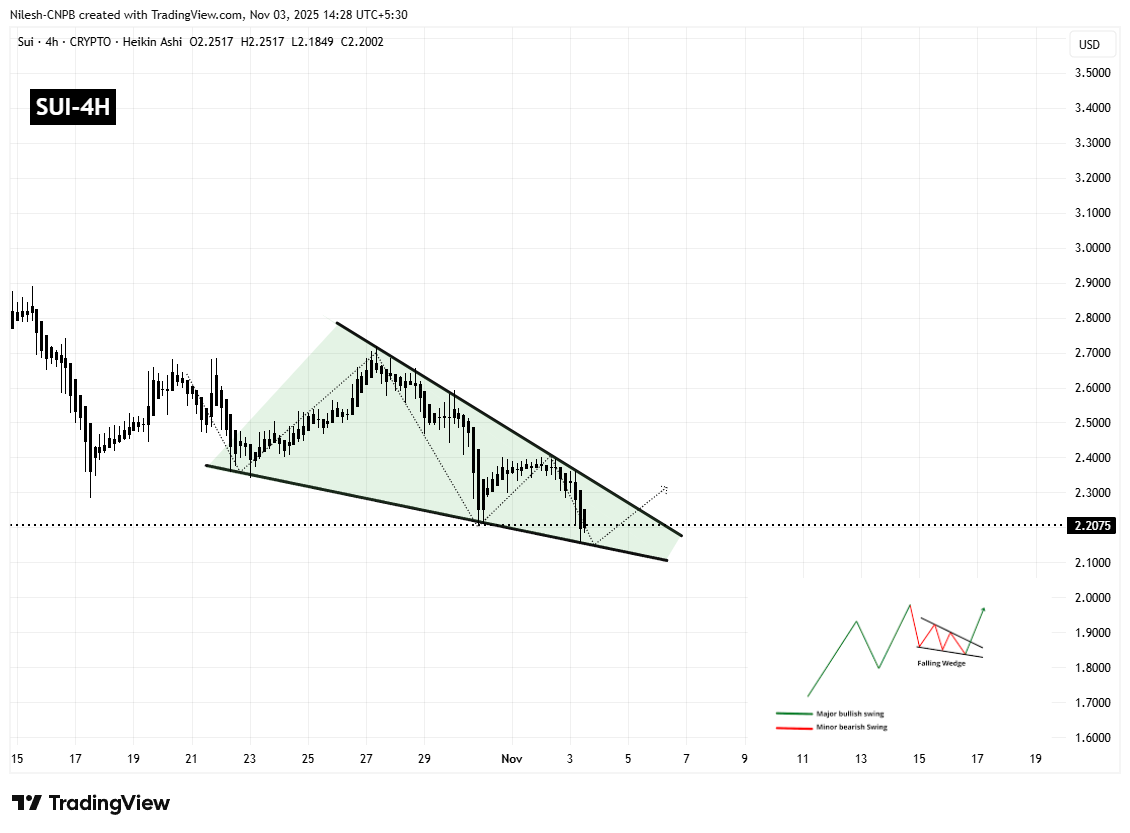 SUI 4H Chart/Coinsprobe (Source: Tradingview)
Each time price action has touched the wedge’s support, quick buying reactions have followed — highlighting the market’s recognition of this range as a key accumulation area.
What’s Next for SUI?
If SUI successfully holds above the wedge’s support line, the token could soon attempt to retest the $2.25 resistance, with the potential to break higher toward the $2.70–$2.90 region. Such a move would align with the typical bullish breakout behavior seen after a falling wedge pattern completes.
However, a failure to hold the $2.14 trendline support could invalidate the pattern and expose the token to deeper losses, likely dragging it toward the $2.00 psychological zone.
At the current stage, the setup appears cautiously optimistic — suggesting that if the broader market stabilizes, SUI might be positioning itself for a technical rebound in the coming sessions.