
Bitcoin Short-Term Holders Face Prolonged Pain As Key Metric Stays Red

As Bitcoin continues to underperform in the fourth quarter of 2025, its investors have had multiple reasons to offload and shave off their holdings. Among these investors is a certain cohort, its short-term holders (STHs), who have been facing heat over an extended period.
STH MVRV In Deep Red For 60 Consecutive Days
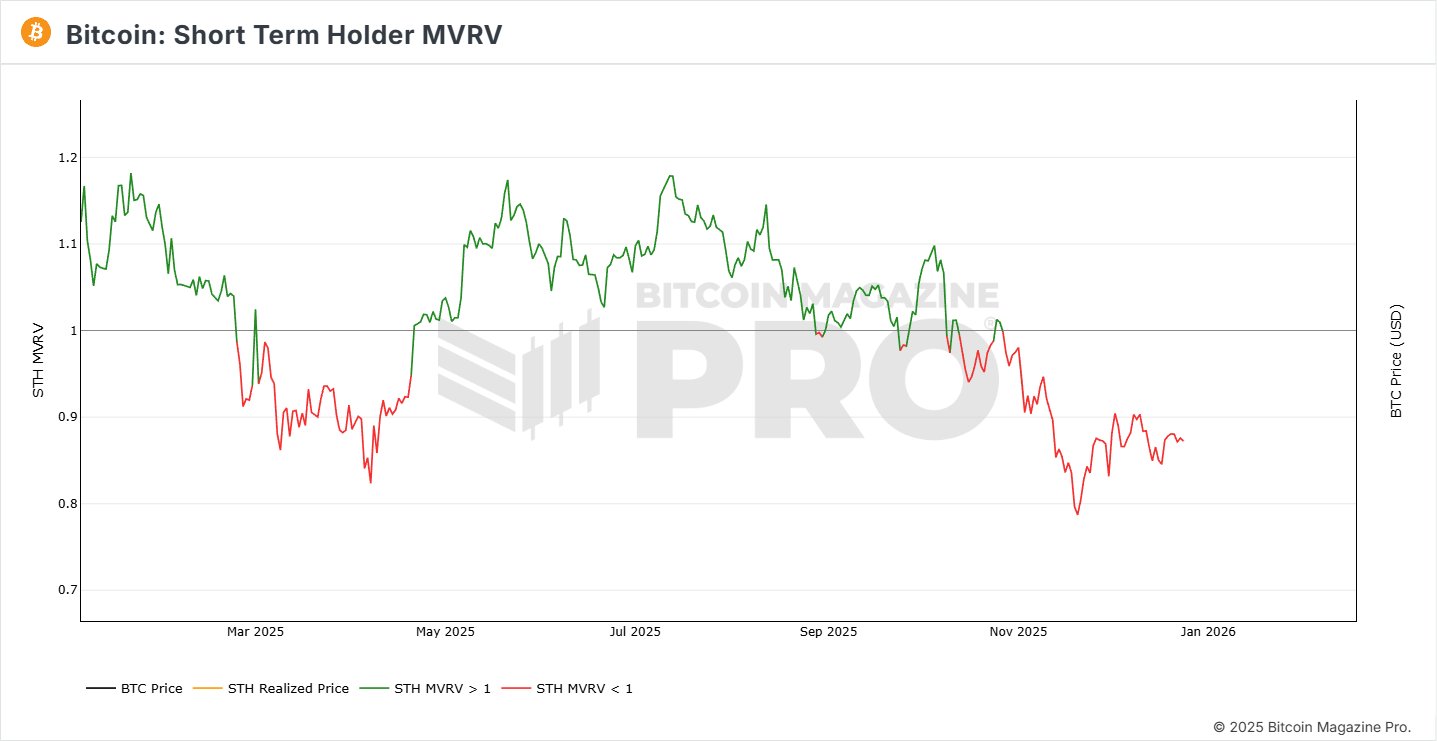
In a recent post on the X platform, market quant Burak Kesmeci revealed an interesting perspective regarding the current market condition for Bitcoin’s most reactive investors — the short-term holders. Kesmeci’s post revolves around the STH MVRV (Market Value to Realized Value) metric.
For context, this metric compares the market value of BTC to its realized value, thus serving as a means to track whether Bitcoin’s short-term investors are, on average, in profit or at a loss.

A reading less than the neutral “1” level typically indicates that the STHs are in the red. Depending on the depth of this value, it could also foreshadow capitulation events. On the other hand, values above 1 reveal that short-term investors are in profit. The higher the value, the more probable it is for profit-taking events to follow.
 Source: @burak_kesmeci on X
In his post on X, the online pundit shared that the STH MVRV has been in deep red territory for a full period of 60 days. Kesmeci explained that the flagship cryptocurrency’s short-term investors are now facing the highest level of “patience test” that they have ever witnessed throughout 2025.
Notably, prolonged periods of negative MVRV readings have often correlated with heightened market stress. Seeing as the market’s most-reactive investor cohort is the one concerned, the Bitcoin price could witness the effect of capitulation-driven sell-offs.
However, the opposite is also possible. In the scenario where bearish pressure eases off completely, prolonged negative readings could be a sign of imminent market stabilization.
Bitcoin Stays Beneath 111-Day SMA — What This Means For Price
To lend more weight to his on-chain revelation, Kesmeci also followed up with a key technical observation of Bitcoin’s price action. According to the analyst, Bitcoin has been trading below the 111-day simple moving average (SMA 111) within the same period.
This alignment between on-chain and technical analysis thus functions to reinforce a clear narrative; Bitcoin is either currently at a consolidatory or corrective phase. This is contrary to the belief that the premier cryptocurrency might be at the start of a significant upward trend.

From a broader perspective, Bitcoin’s future trajectory is not completely clear. Macro events, alongside renewed spot demand, could prove pivotal for the cryptocurrency in the future.
This market phenomenon could determine whether BTC plunges deeper to the downside or begins its recovery journey. As of this writing, Bitcoin is valued at around $87,380, with no significant movement in the past day.
 The price of BTC on the daily timeframe | Source: BTCUSDT chart on
Disclaimer: The content of this article solely reflects the author's opinion and does not represent the platform in any capacity. This article is not intended to serve as a reference for making investment decisions.
You may also like
XRP Pundit: First Thing You Should Do When You Become a Crypto Millionaire
 VIPTradFi Focus: Where Does the RWA Market Stand Today?
1. Crypto outperformed traditional equity indexes following the rate hike, but elevated interest rates remain a key constraint on cross-asset allocation. From September 12 to 18, BTC, ETH, and SOL gained 4.83%, 3.84%, and 9.96%, respectively, while the S&P 500 edged down 0.08%. The U.S. Dollar Index rose 1.11%, and the 10-year U.S. Treasury yield closed at approximately 4.998%. Improving risk appetite is therefore coexisting with elevated discount rates, raising the bar for RWA allocation: investors need to compare not only returns on the underlying assets, but also on-chain liquidity and collateral efficiency. 2. Growth in tokenized equities is occurring even as the overall RWA market remains under pressure. As of September 18, Distributed Asset Value across RWAs stood at $38.503 billion, down 1.13% week over week, while tokenized equities reached $3.056 billion, up 6.03%. This week's data are better explained by capital reallocating across different RWA segments than by a broad-based expansion of the entire RWA market. 3. For exchanges, the opportunity lies in connecting spot holdings, collateral, and derivatives. Reality's distributed asset value stands at approximately $155 million, while eligible rTokens can already be used within Bitget's UTA margin framework. Across CoinGlass's verifiable sample of 177 TradFi instruments, open interest reached approximately $11.498 billion, up 2.06% week over week, even as weekly trading volume declined 7.60%. The medium-term opportunity remains intact, but deeper utilization will depend on liquidity, collateral use, and sustained trading activity. 4.Assets to watch: BTC, ETH, SOL, NEAR, ZEC, gold, tokenized U.S. equities, COST. 5.Key metrics to watch: rToken collateral utilization, the durability of TradFi open interest and trading volume, and next week's employment and consumer data.

Gold prices fall Rs 1,331/10 gram, silver dips Rs 1,600/kg as Mideast tensions outweigh oil fall: Key levels to track
Strategists Say Market's ‘Wall of Worry' Is Healthy, Not a Warning Sign

Crypto prices
More


