

- PEPE is priced at $0.053869 and fell by 2.4 and is close to the support of $0.053848.
- The day trading was narrow in the range of $0.053848 to $0.054004 and this meant that the volatility was controlled.
- Market capitalization was 1.63B, which fell by 3.28M (-0.20%), and was aligned weak against BTC (-1.6%) and ETH (-1.3%).
The market action grew sensitive on the part of Pepe as the price action narrowed around a well defined intraday support zone. PEPE was trading at $0.053869, which is a 2.4% decrease on a session at the time of writing. This movement followed steady intraday pressure that pushed price toward a narrow lower boundary. Notably, trading behavior remained contained within a tight range, keeping volatility controlled. As a result, market participants continued to focus on short-term structure rather than expansion. This context sets the foundation for examining support behavior, range dynamics, and volume alignment.
PEPE Maintains Support Amid Orderly Decline and Stable Pair Correlations
PEPE hovered just above its $0.053848 support level, maintaining proximity without triggering a decisive breakdown. However, sellers maintained pressure throughout the session. This range defined immediate market boundaries. Consequently, price action respected both extremes without invalidation. As the session progressed, the market continued to defend support. This behavior preserved short-term equilibrium and introduced the next focus: relative performance against major pairs.
PEPE fell 1.6% versus Bitcoin and 1.3 versus Ethereum, which strengthens comparative weakness in key trading pairs. However, the declines aligned proportionally with the USD move. This alignment suggested consistent selling rather than isolated pair-specific pressure. Meanwhile, correlation between pairs remained stable, preventing abnormal divergence. As price maintained its structure, traders shifted attention toward confirmation signals. Therefore, examining momentum and volume behavior became essential for contextual continuity.
PEPE Consolidates as Market Shows Balanced Momentum
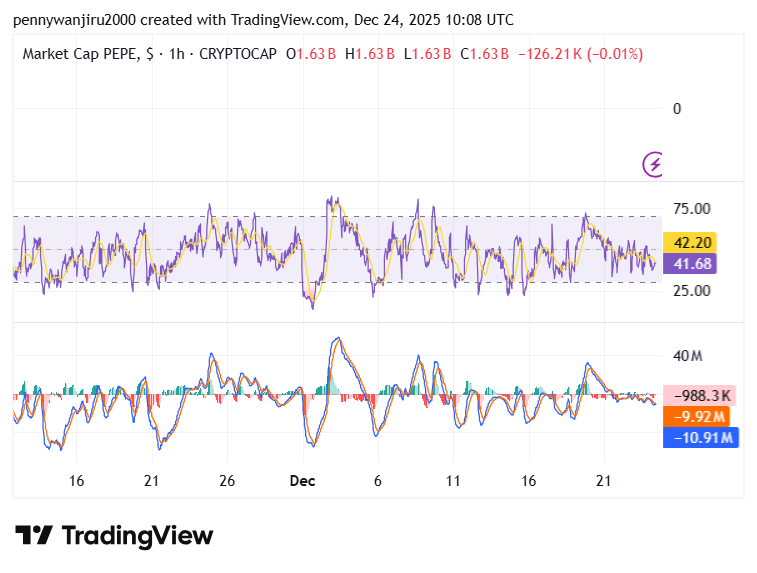
Market capitalization settled near $1.63 billion, reflecting a $3.28 million contraction, equivalent to -0.20%. Meanwhile, volume indicators showed no expansion. This condition supported ongoing consolidation rather than acceleration.
 Source:
TradingView
Source:
TradingView
Notably, momentum oscillators remained within established bounds, reflecting balance between buyers and sellers. The RSI is currently trading at 42.21 which shows that PEPE is neither overbought nor oversold. However, the MACD line is trading below the signal line showing bearish momentum. As price stayed compressed, the structure allowed room for directional resolution. Any continuation depended on sustained interaction with support and resistance levels. Thus, the market remained positioned within a defined framework, awaiting confirmation through range interaction rather than abrupt displacement.





