

Date: Sun, Dec 28, 2025 | 11:20 AM GMT
The broader cryptocurrency market is showing modest strength, with both Bitcoin (BTC) and Ethereum (ETH) trading in the green. This steady performance among major assets has helped stabilize overall market sentiment, creating room for select altcoins — including Worldcoin (WLD) — to develop constructive technical setups.
At the time of writing, WLD is trading with a modest intraday gain. More importantly, a notable whale accumulation combined with an improving lower-timeframe structure suggests that momentum may be shifting in favor of the bulls.
 Source: Coinmarketcap
Major Accumulation
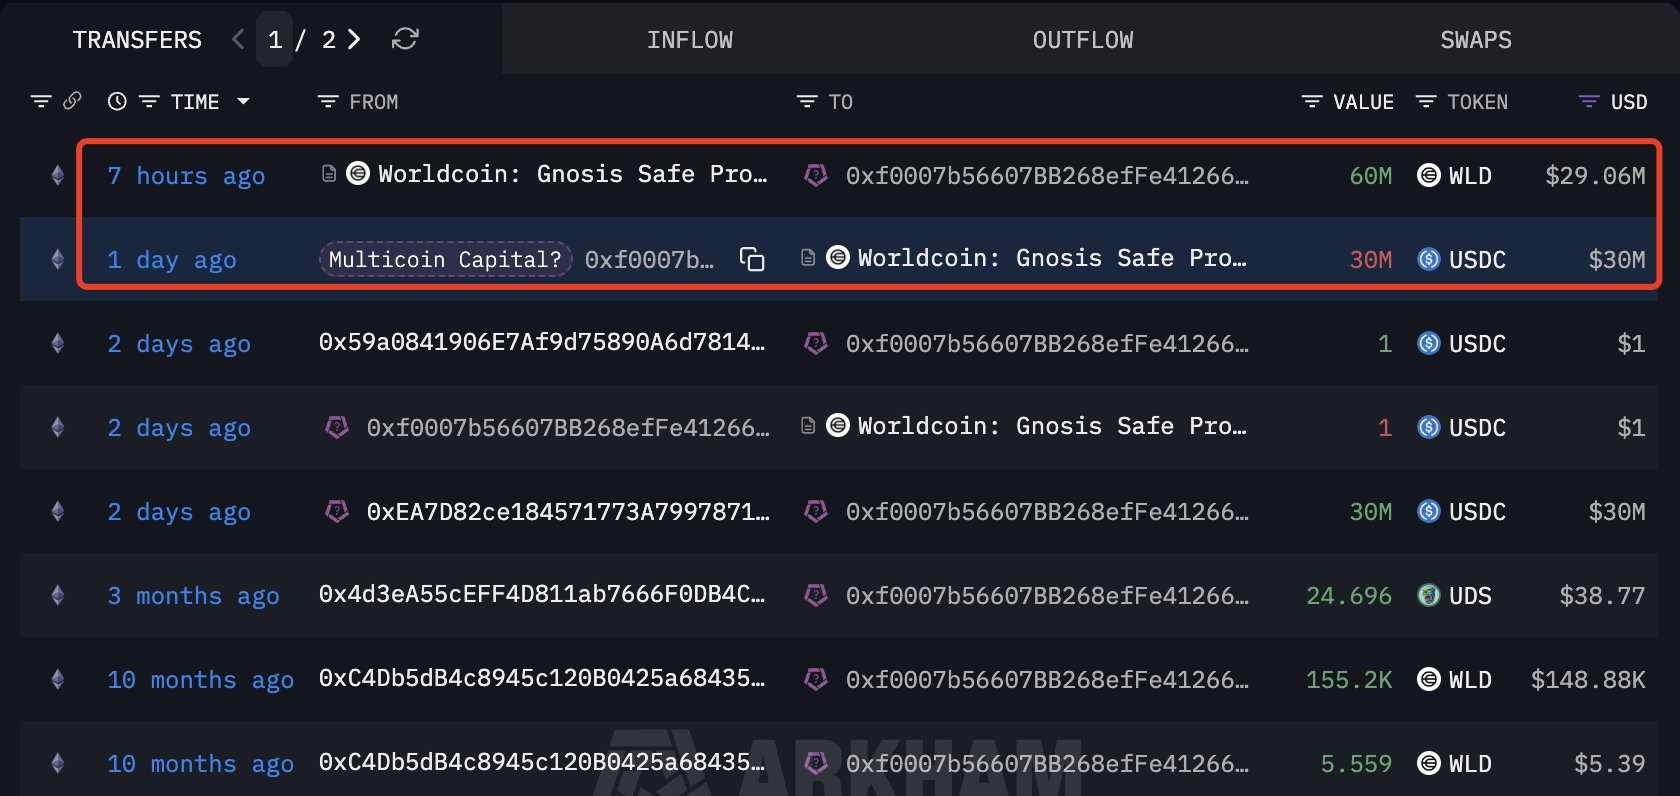
On-chain data has added an extra layer of confidence to WLD’s current setup. According to Lookonchain, on December 25, a wallet (0xf000) linked to Multicoin Capital spent $30 million USDC to acquire 60 million WLD at an average price of $0.50 through an OTC deal.
 Source: @lookonchain (X)
Such large-scale accumulation near key support levels often signals long-term conviction rather than short-term speculation.
Adam and Eve Pattern in Play
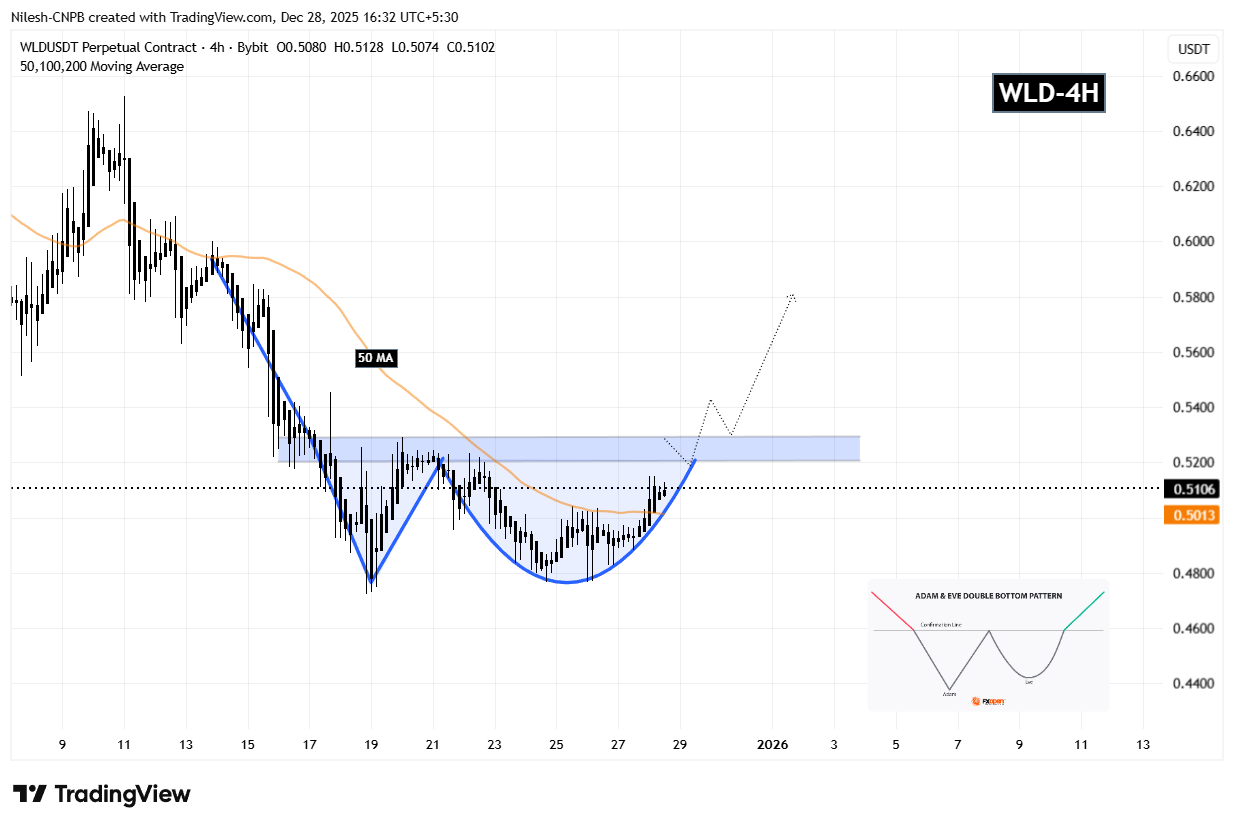
On the 4-hour chart, WLD is forming a textbook Adam and Eve double bottom pattern — a bullish reversal structure that frequently marks the end of downtrends.
The pattern began after WLD faced rejection from the $0.5202–$0.5290 resistance zone. The initial decline was sharp and aggressive, forming the V-shaped “Adam” bottom near the $0.47 region. This was followed by a second, more rounded decline — the “Eve” portion — which bottomed at a similar price level, reinforcing strong demand in that zone.
 Worldcoin (WLD) 4H Chart/Coinsprobe (Source: Tradingview)
Since completing the second bottom, WLD has steadily pushed higher, reclaimed the 50-period moving average, and is now carving out the right side of the structure near $0.5106. Price is currently pressing against the neckline area, signaling that a decisive move may be approaching.
What Next for WLD?
If WLD continues to hold above the 50 MA support near $0.5013, the bullish structure remains intact. A clean breakout above the $0.5290 neckline, ideally followed by a successful retest, would confirm the Adam and Eve pattern.
Once confirmed, the projected measured move points toward the $0.58 region, suggesting a potential upside of roughly 13% from current levels. This aligns closely with the projected path shown on the chart and would mark a meaningful trend shift on the lower timeframe.
On the flip side, failure to hold the 50 MA could delay the breakout scenario and keep WLD range-bound in the near term. As long as that support holds, however, the technical bias remains tilted to the upside.
Disclaimer
About Author





