
Dogecoin (DOGE) Bulls Make A Move — Then Slam Into Resistance

Dogecoin started a recovery wave above the $0.120 zone against the US Dollar. DOGE is now facing hurdles near $0.1240 and might struggle to continue higher.
- DOGE price started a recovery wave from $0.1175 and climbed above $0.120.
- The price is trading below the $0.1250 level and the 100-hourly simple moving average.
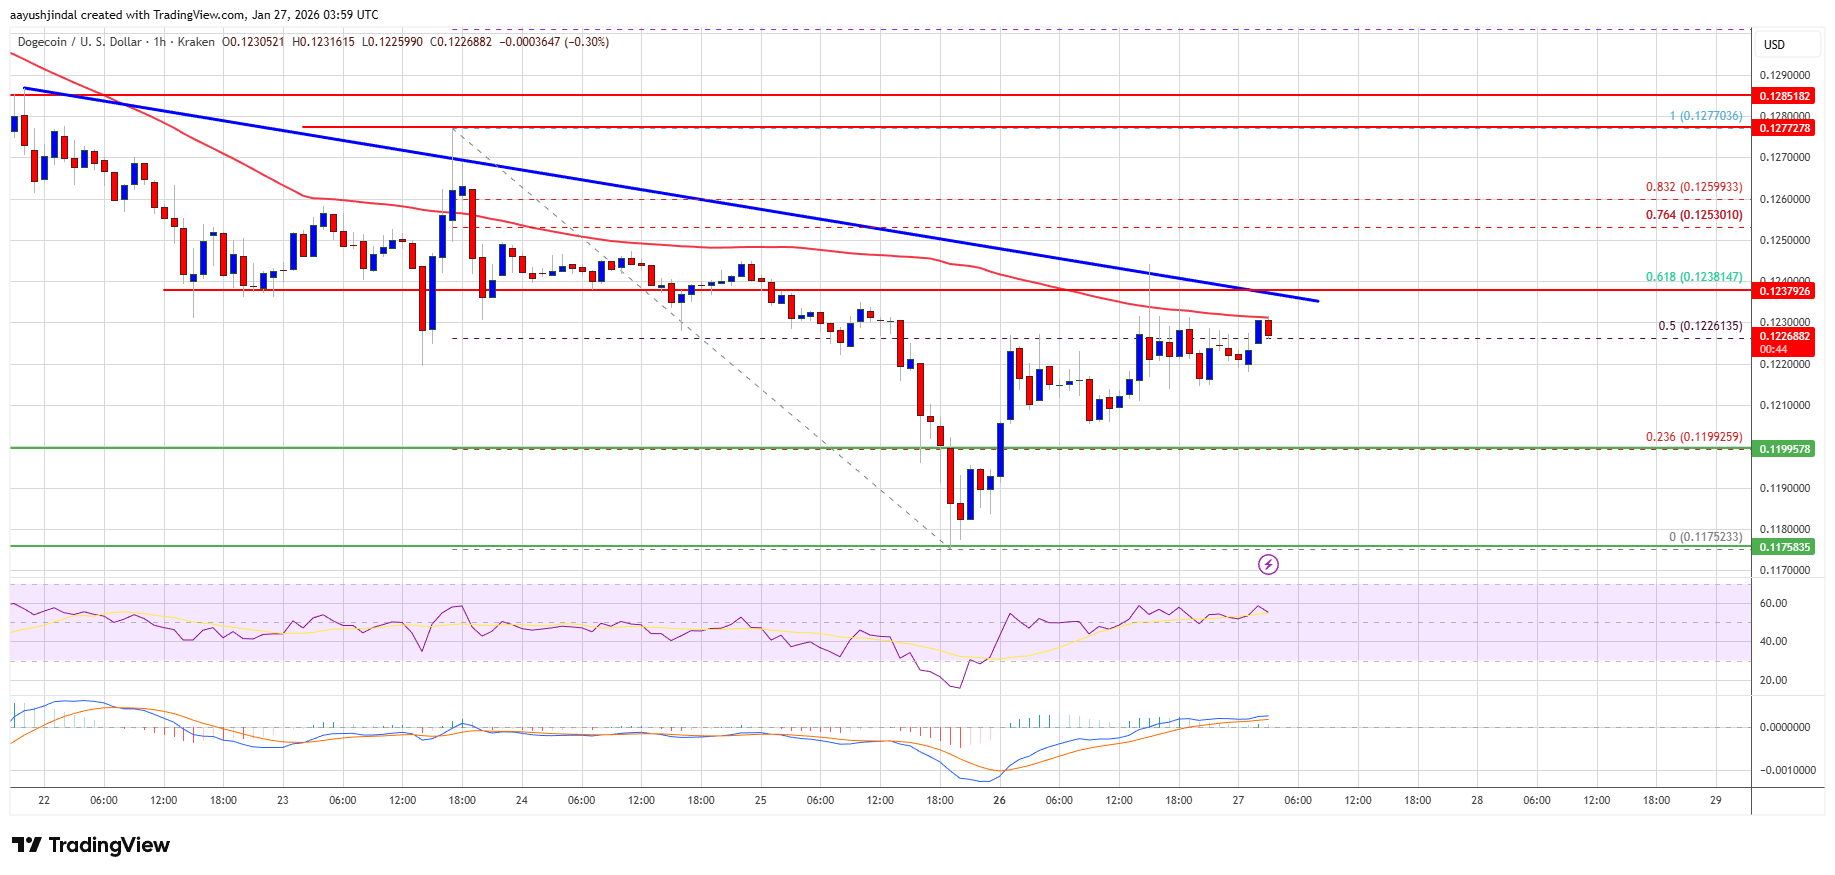
- There is a bearish trend line forming with resistance at $0.1240 on the hourly chart of the DOGE/USD pair (data source from Kraken).
- The price could continue to move up if it stays above $0.1240.
Dogecoin Price Runs Into Resistance
Dogecoin price started a recovery wave from the $0.1175 zone, like Bitcoin and Ethereum. DOGE climbed above the $0.1180 and $0.120 resistance levels.
There was a decent upward move above the 50% Fib retracement level of the downward move from the $0.1277 swing high to the $0.1175 low. However, the bears are active near the $0.1240 level. Besides, there is a bearish trend line forming with resistance at $0.1240 on the hourly chart of the DOGE/USD pair.
Dogecoin price is now trading below the $0.1230 level and the 100-hourly simple moving average. If there is a recovery wave, immediate resistance on the upside is near the $0.1240 level, the trend line, and the 61.8% Fib retracement level of the downward move from the $0.1277 swing high to the $0.1175 low.
 Source:
DOGEUSD on TradingView.com
Source:
DOGEUSD on TradingView.com
The first major resistance for the bulls could be near the $0.1280 level. The next major resistance is near the $0.1320 level. A close above the $0.1320 resistance might send the price toward the $0.140 resistance. Any more gains might send the price toward the $0.1450 level. The next major stop for the bulls might be $0.150.
Another Decline In DOGE?
If DOGE’s price fails to climb above the $0.1240 level, it could continue to move down. Initial support on the downside is near the $0.120 level. The next major support is near the $0.1180 level.
The main support sits at $0.1150. If there is a downside break below the $0.1150 support, the price could decline further. In the stated case, the price might slide toward the $0.1080 level or even $0.1050 in the near term.
Technical Indicators
Hourly MACD – The MACD for DOGE/USD is now losing momentum in the bearish zone.
Hourly RSI (Relative Strength Index) – The RSI for DOGE/USD is now above the 50 level.
Major Support Levels – $0.1180 and $0.1150.
Major Resistance Levels – $0.1240 and $0.1280.
Disclaimer: The content of this article solely reflects the author's opinion and does not represent the platform in any capacity. This article is not intended to serve as a reference for making investment decisions.
You may also like
European Stocks Close Higher in Wednesday Trading as Oil Prices Drop; UK Inflation Accelerates in August
Cenovus Energy Inc. Price Target Raised to C$51.00/Share From C$46.00 by Raymond James
Cardinal Energy Ltd. Raised to Outperform From Market Perform by Raymond James
Richelieu Hardware Ltd. Is Maintained at Sector Perform by National Bank
Crypto prices
More


