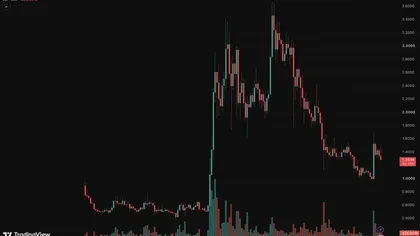
Solana [SOL] has sunk toward the $100 support zone after failing to breach the $150 supply zone.
The bulls had been trying to climb past this resistance since mid-November, but the recent market-wide selling sent the altcoin lower.

Source: SOL/USDT on TradingView
SOL has a bearish bias on the weekly chart. After the strong performance toward the end of 2024, it saw a bearish structure break in April 2025.
The rejection in September 2025 at the 78.6% retracement level at $252.9 proved that the structure break in April was not a liquidity sweep but a true trend shift.
At the time of writing, it appeared highly likely that SOL would fall below the $95 swing low from April 2025.
The bullish arguments for Solana
Recently, AMBCrypto explored the possibility of a Solana rally toward $300. This was deemed unlikely until the bulls reclaimed the key supply zone at $150.
Another report highlighted that prediction sites such as Kalshi were pessimistic about SOL rallying toward ambitious targets such as $450.
For those with a longer investment horizon, the $1,000 price target was perfectly feasible. VanEck modeled a bullish scenario that presented a price target of $3,200 for SOL by 2029.
News that the network experienced increased on-chain activity was also welcome. It is possible this could make SOL more attractive as an investment, as speculation is converted into tangible economic value.
Traders’ call to action – Sell the bounce

Source: SOL/USDT on TradingView
The 1-day chart saw a bearish swing structure shift, marked in orange. The $120 and $140 levels were local supply zones. Swing traders can wait for a bounce toward $120 to go short.
The RSI was in oversold territory with a reading of 22. The high selling volume in recent days took the OBV to new multi-month lows.
The $64 and $47.9 were the next long-term support levels. In the coming weeks, $95 and $78 can also see a temporary bullish reaction. A Bitcoin [BTC] drop below $74k would make this bearish scenario more likely.
Final Thoughts
- The weekly Solana chart showed a bearish structure in place, and a move to $95 was imminent.
- Swing traders can use a bounce toward $120 to go short, targeting $78 and $64, especially if Bitcoin falls below and stays below $74k.