-
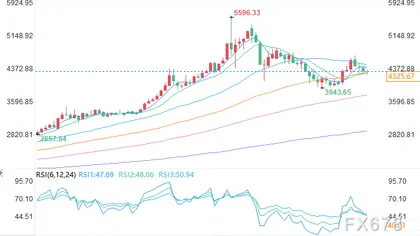
Ethereum price shows elevated risk as transfer counts hit 1.17 million, a level historically linked with market tops.
-
Past spikes in network activity during 2018 and 2021 aligned with sharp drawdowns and volatility peaks.
-
MVRV bands suggest historical downside zones remain relevant below $2,000 if stress persists.
Ethereum price is trading under pressure as on-chain data flashes a historically sensitive signal. In late january, Ethereum crypto’s total transfer count, smoothed by a 14-day SMA, surged to 1.17 million, a level previously associated with major market turning points. This sudden spike raises fresh questions about near-term risk.
Ethereum Network Activity Reaches a Critical Threshold
The latest Ethereum price chart is unfolding amid sharply rising network activity. According to on-chain data, the transfer count has accelerated sharply, reaching levels rarely sustained in past market cycles. While increasing activity can indicate adoption, the speed and magnitude of this move place it in a more cautionary category.
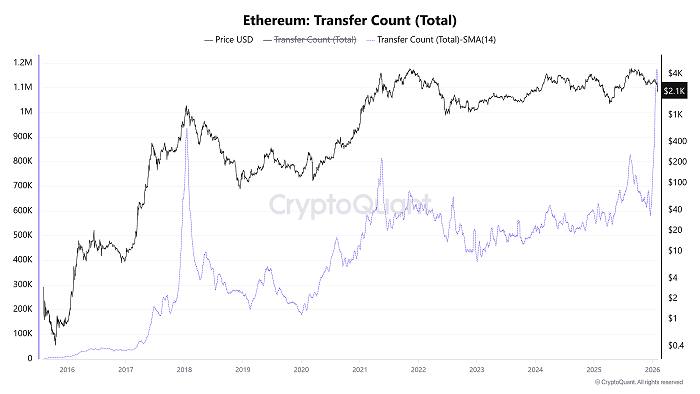
Historically, such abrupt spikes tend to appear near periods of elevated stress. Meanwhile, price action on higher timeframes has already softened, suggesting that activity may not be driven purely by organic growth. Instead, it may reflect increased repositioning as market participants adjust exposure.
Historical Parallels Resurface From 2018 and 2021
A closer look at Ethereum crypto’s historical data reinforces the concern. In January 2018, transfer counts surged in a similar fashion just days before Ethereum marked its cycle peak. At the same time, price momentum stalled and gave way to an extended bear market.
A comparable pattern emerged on May 19, 2021. Transfer activity spiked sharply as price volatility intensified, coinciding with a broad market crash. In both cases, elevated network usage reflected distribution and forced flows rather than healthy accumulation. While history does not repeat exactly, the structural similarity keeps risk elevated.
On-Chain Signals Point to Distribution and Volatility
From an analytical standpoint, parabolic increases in transfer counts often align with moments of emotional extremes. That said, these phases typically involve heavy asset movement between wallets and exchanges. This behavior suggests profit realization, collateral rebalancing, or liquidation-driven transfers.
At the same time, volatility tends to climax near these events. The Ethereum crypto ecosystem has historically seen spikes in transaction volume when conviction weakens on one side of the market. As a result, heightened activity alone does not confirm direction but signals instability.
MVRV Bands Highlight a Lower Valuation Zone
Adding to the cautionary tone, Ethereum crypto’s MVRV pricing bands are drifting toward historically significant territory. The Ethereum price USD has often formed durable bottoms only after dipping below the 0.80 MVRV band, a level that currently maps to just under $2,000.
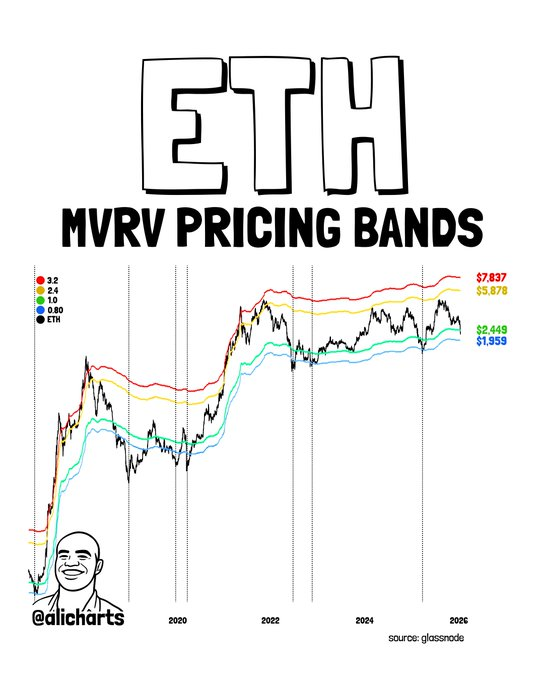
In previous cycles, price spent prolonged periods consolidating near this lower valuation envelope before recovery phases began. From a structural perspective, the Ethereum price prediction remains sensitive to whether this zone is tested or defended. Meanwhile, cost-basis dynamics continue to rise slowly, lifting the long-term floor but not eliminating downside risk.
Ethereum Price Balances Between Risk and Repricing
Still, markets rarely move in straight lines. While current signals suggest elevated risk, they also reflect a market in transition. As speculative excess is absorbed, the Ethereum price may continue searching for equilibrium within historically relevant valuation ranges. Whether activity stabilizes or accelerates further will remain central to near-term direction.