-
BTC price is trading around $68,890 while the Sharpe Ratio enters a zone historically seen near late-stage bear markets
-
Risk-adjusted returns remain unattractive, even as contrarian signals begin to form
-
Market stress reflects positioning pressure, not trend confirmation
The BTC price is hovering near $68,890 today after a brief recovery from $60K. But, the key risk metric, the Sharpe Ratio, shows intact caution. It shows that BTC’s sharpe ratio has slipped into a historical bear-market zone. Rather than signaling an immediate bottom, this shift highlights rising risk relative to returns, a dynamic that has often appeared near long, complex market turning phases.
Sharpe Ratio signals growing stress, not capitulation
The Sharpe Ratio, which measures risk-adjusted returns, has now entered a zone historically associated with the later stages of Bitcoin bear markets. In practical terms, this means investors are currently taking on elevated risk for relatively weak performance.
Meanwhile, the ratio continues to deteriorate, underscoring that recent BTC returns remain insufficient to justify volatility. At the same time, this type of compression has often emerged before broader trend stabilization, not during periods of optimism.
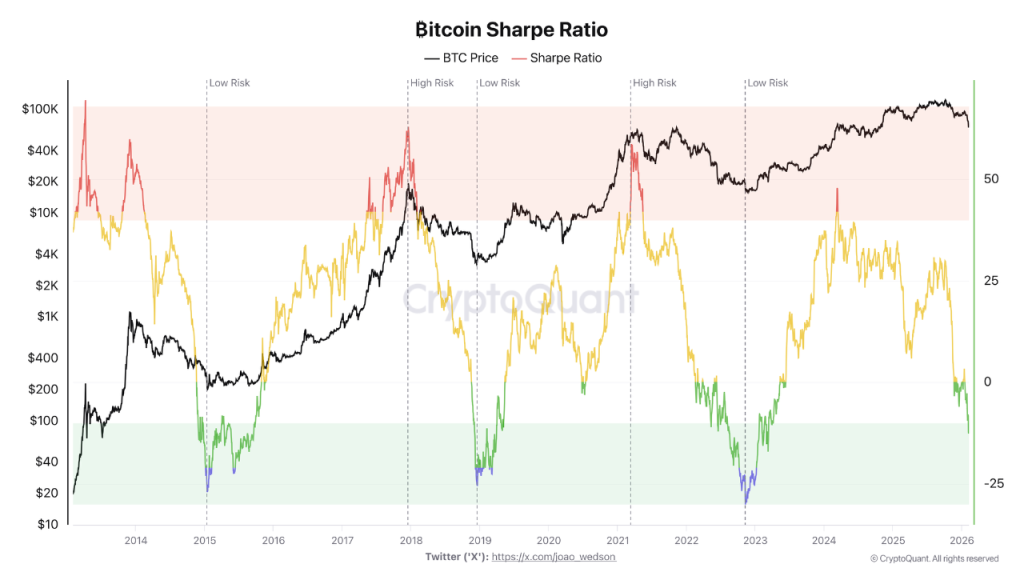
Importantly, the Sharpe Ratio should not be interpreted as a timing tool. Rather, it reflects the consequences of price behavior already in motion. As BTC crypto performance weakens on a risk-adjusted basis, more participants find themselves underwater, increasing stress across shorter time horizons.
Contrarian dynamics begin to surface
Still, market history shows that extreme Sharpe Ratio readings often align with contrarian opportunity zones. That does not imply an imminent reversal. Instead, it suggests the market may be entering a phase where long-term positioning slowly becomes more defensible.
From a behavioral perspective, prolonged underperformance tends to reduce speculative excess, gradually shifting ownership toward participants with longer holding periods.
That said, patience remains critical. This phase can persist for months, and the BTC price today may continue adjusting lower before risk metrics begin to improve meaningfully.
BTC price chart highlights key technical magnets
From a technical perspective, the experts presents his theory that BTC price chart reinforces cautious outlook and shows historical dip odds. Following a peak near $126,000, Bitcoin respected the 0.382 Fibonacci retracement around $78,000, an area that acted as a structural drift zone. Once that level was lost, technical focus shifted lower.
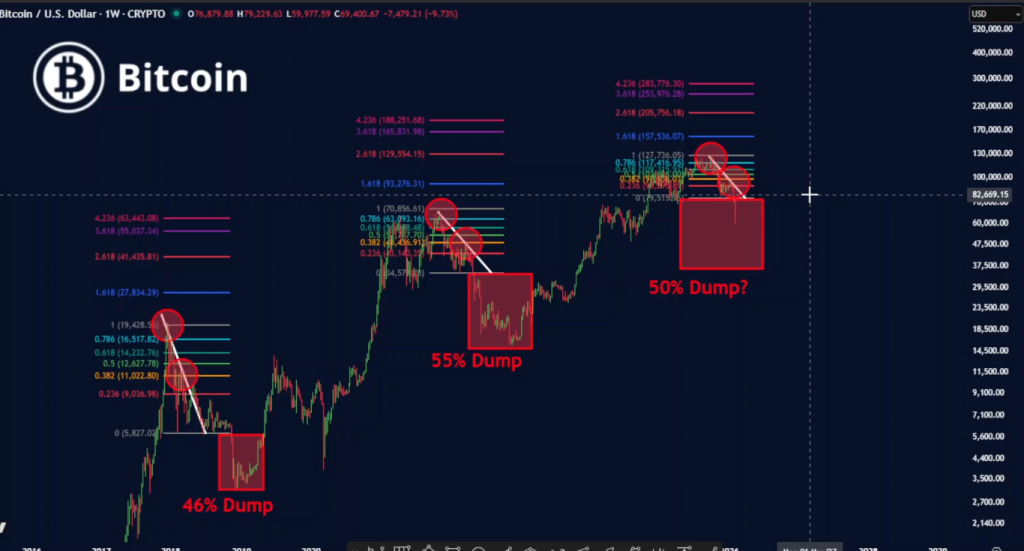
The next major retracement level sits near the 0.618 zone around $48,000, a level that may act as a longer-term magnet should corrective pressure persist.
Risk management takes center stage
As a result, investors are increasingly weighing two broad approaches. One involves gradually building exposure as risk metrics approach historically lower-risk zones. The other prioritizes confirmation, waiting for the Sharpe Ratio to clearly improve before increasing allocation. Neither path implies urgency.
Still, the current setup emphasizes discipline. The BTC price USD remains sensitive to liquidity conditions, and the developing structure suggests that time, rather than speed, is the primary variable. In this environment, BTC price behavior reflects positioning stress more than directional conviction, a dynamic that continues to shape the evolving BTC price forecast.