
Ether holds $2K as traders make push toward overhead short liquidity

Ether (ETH) climbed back above $2,000 on Monday as the altcoin’s derivatives market activity intensified across major exchanges. Data shows more than 110,000 Ether flowed into derivatives platforms, while a key leverage indicator surged to new highs.
The activity points to a rapid buildup of speculative positioning, suggesting traders are preparing for increased volatility as ETH attempts to break out of its monthly trading range.
Ether derivatives inflows meet rising leverage ratio
Ether derivatives exchanges recorded a netflow of 110,343 ETH on March 7, the third-largest spike in 2026. A larger move occurred on Feb. 6, when ETH rallied roughly 13% from its yearly low at $1,736.
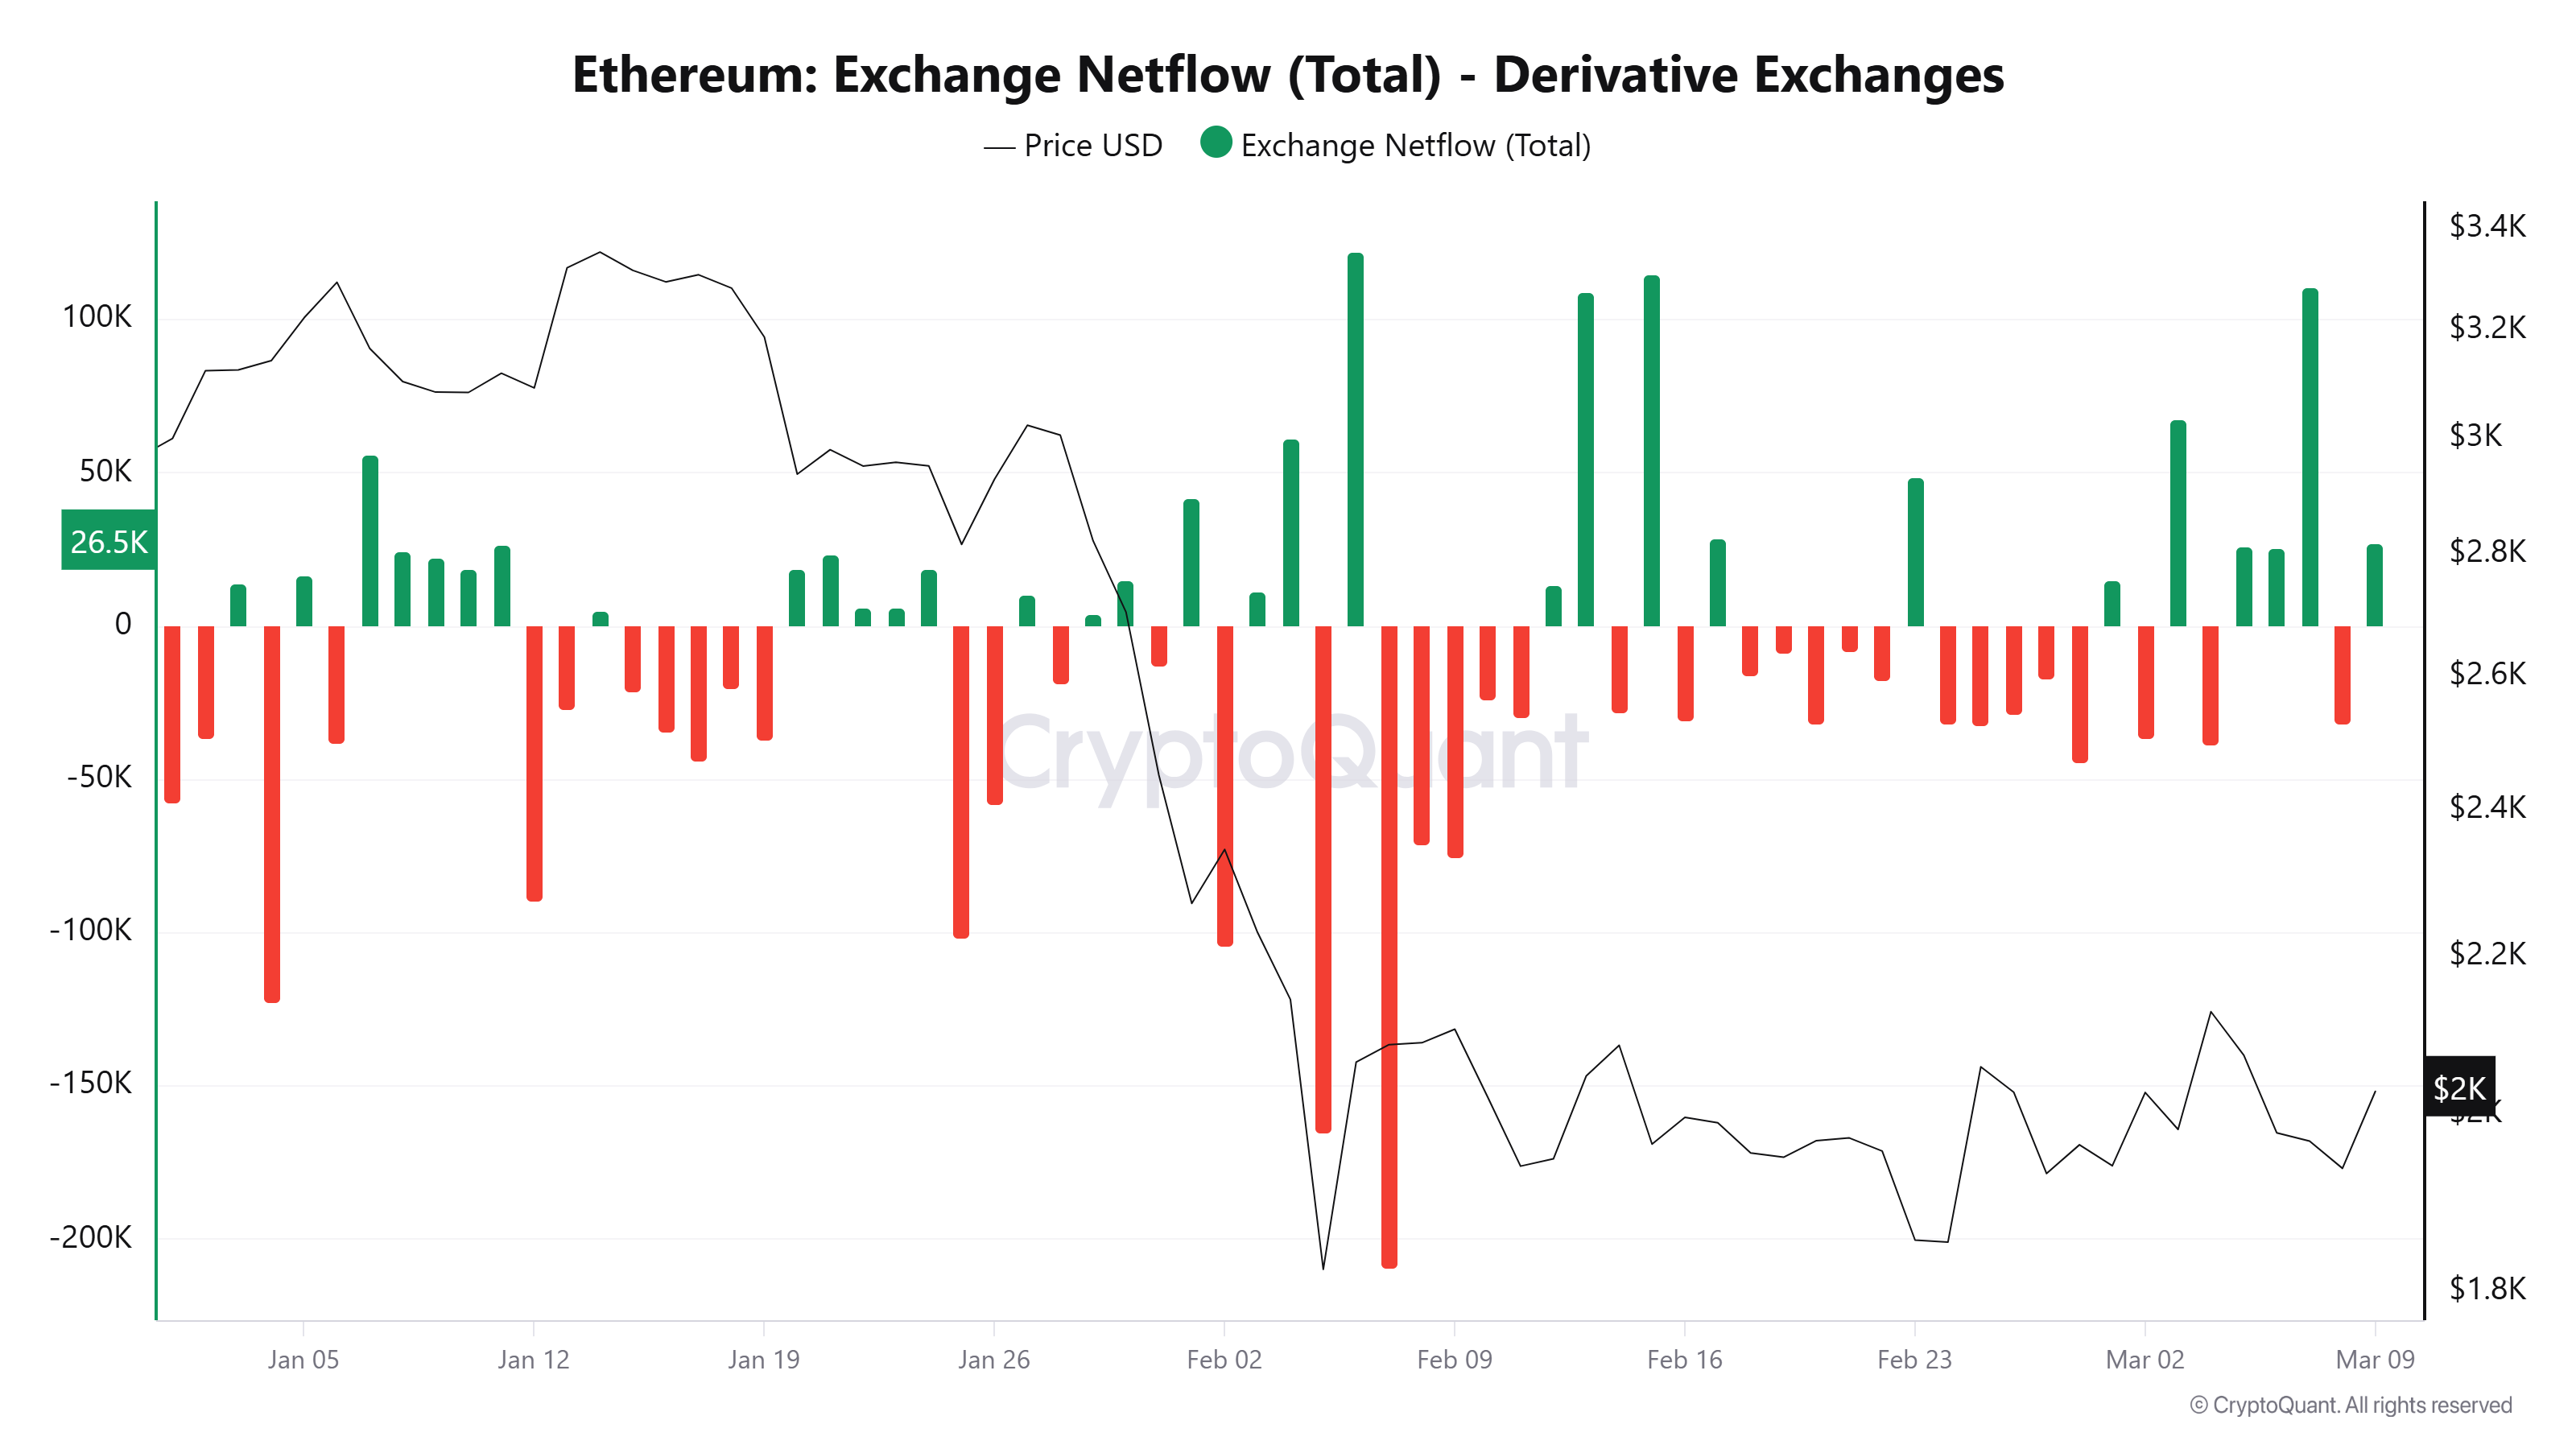
CryptoQuant data shows that the earlier spikes in derivatives inflows frequently preceded short-term drawdowns or periods of sharp volatility.
At the same time, Ether’s estimated leverage ratio climbed to a record 0.78 on Wednesday, exceeding the previous high of 0.778 recorded on Jan. 1. The metric tracks the amount of open interest relative to exchange reserves, and it is widely used to gauge how aggressively traders employ borrowed capital.
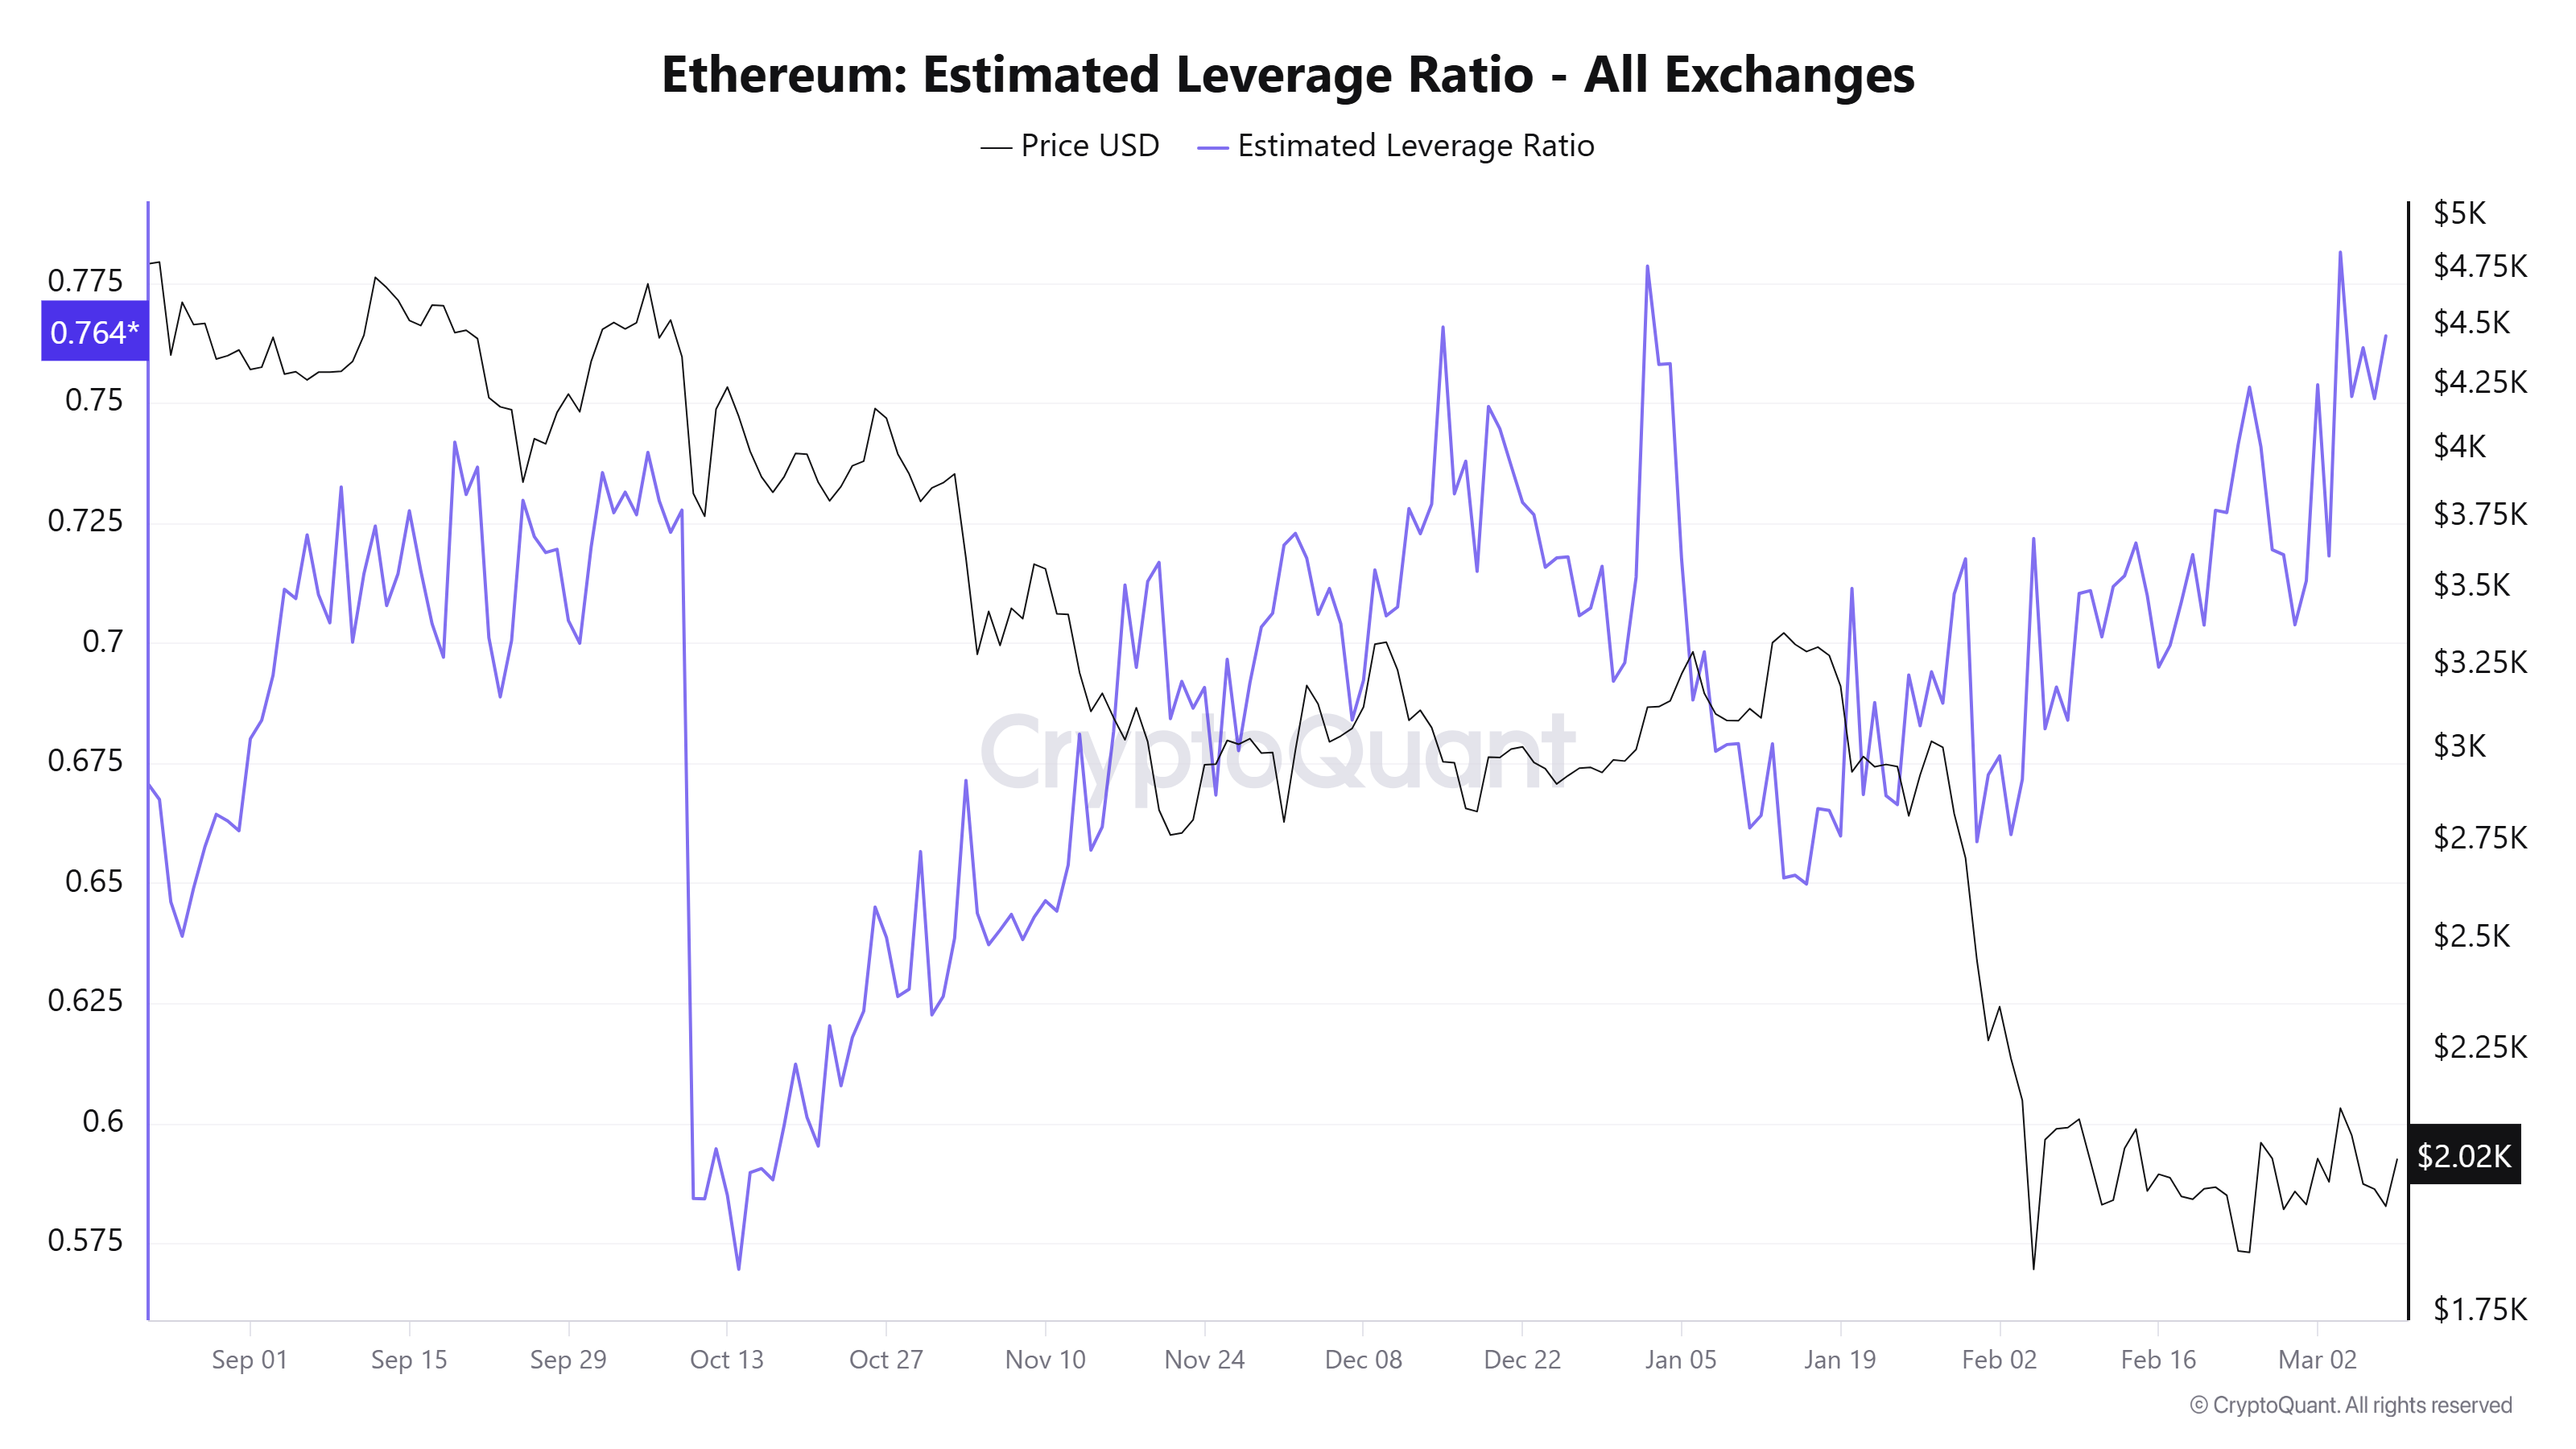
A higher reading means a larger share of the positions rely on leverage. Such conditions tend to amplify the price move in either direction as liquidations build across the derivatives markets.
Key liquidity sits near $2,050
Ether trades inside a monthly range between $1,800 and $2,000 following a swing failure pattern near $2,150 last Wednesday. The rejection signaled profit-taking above local highs, and the price retraced to the internal liquidity levels near $1,900 and $1,950 formed early last week.
The one-hour chart now shows a bullish pivot on the one-hour timeframe, which tracks the recovery on Monday after a liquidity sweep happened near $1,908 on Sunday.
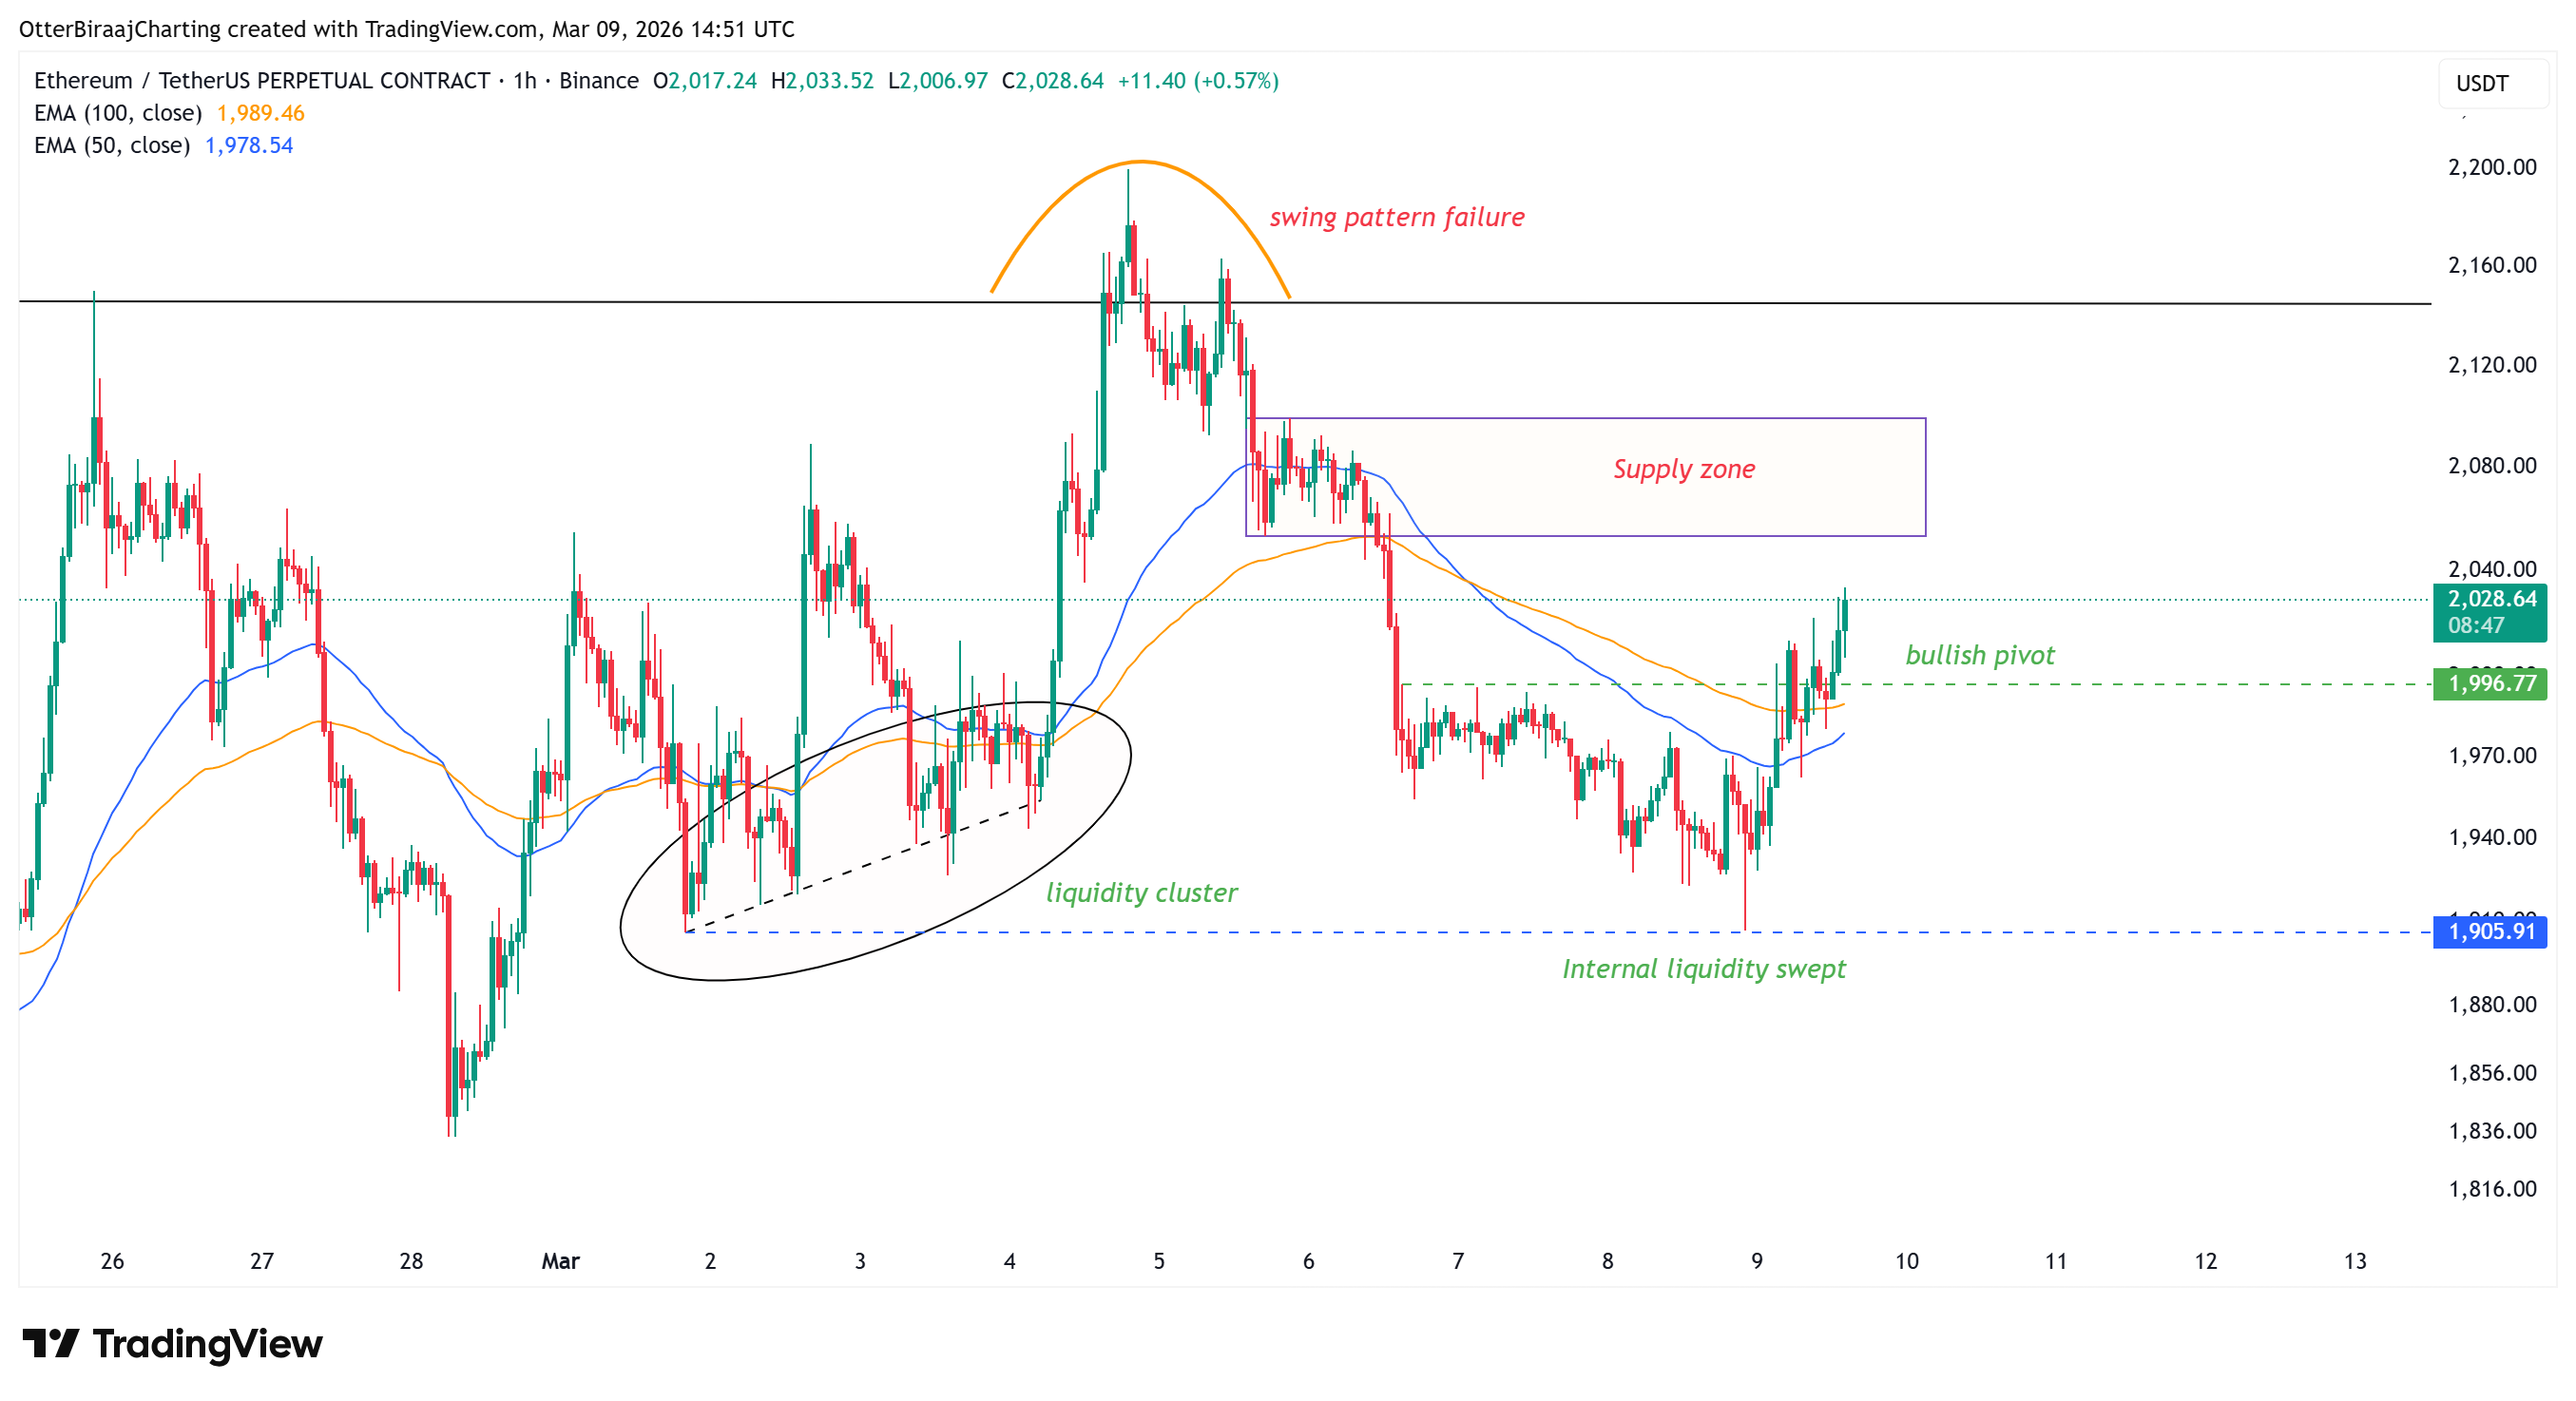
The market’s current attention may shift toward the supply zone between $2,050 and $2,100 formed late last week. A clear breakout above that range and establishing it as support may allow ETH to break significantly above $2,150.
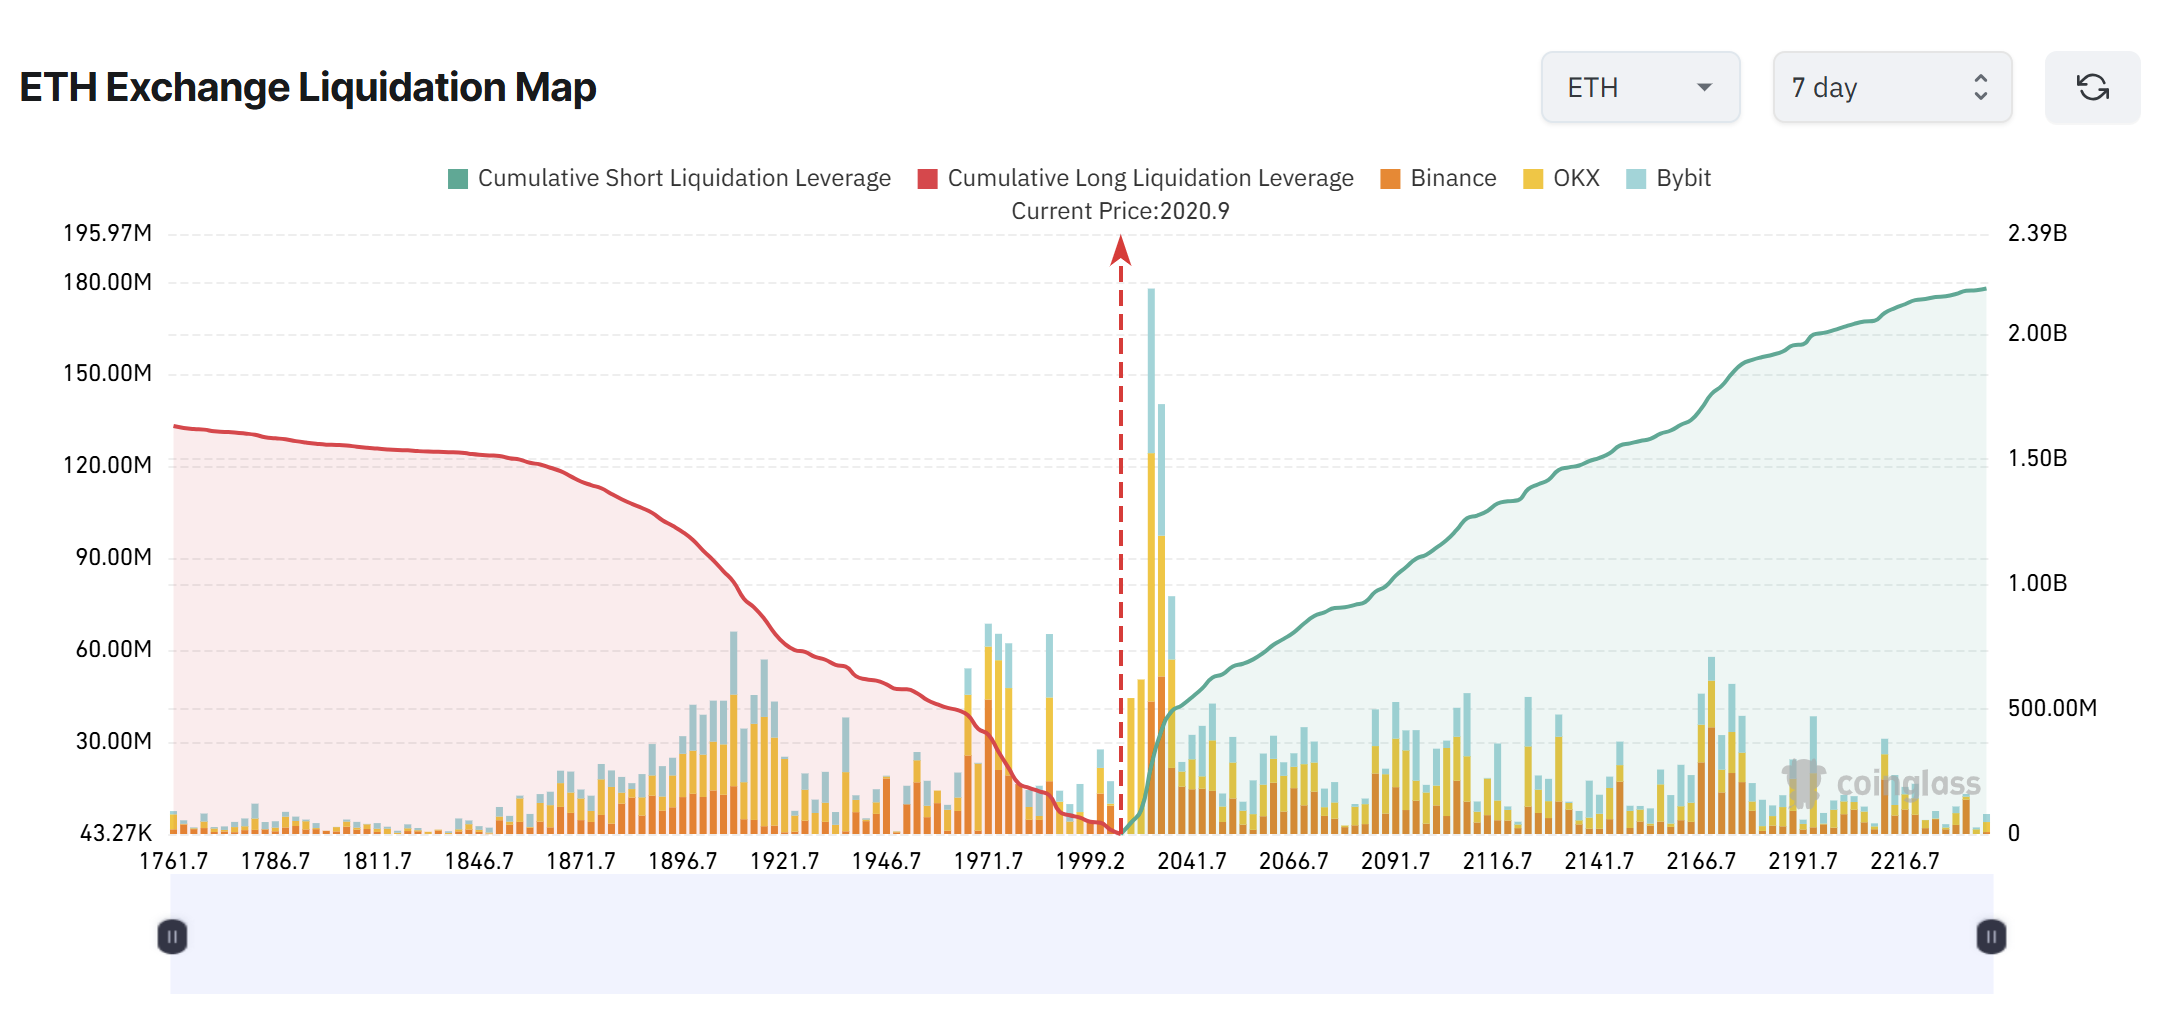
The seven-day liquidation data from CoinGlass shows a dense cluster of short positions above the current price. Roughly $273 million in cumulative short-liquidation leverage sits near $2,030.
Large concentrations of short liquidations often act as magnet levels for the price. A move into that zone may trigger forced buybacks from the overleveraged short positions, which may accelerate the upside volatility if tagged in quick succession.
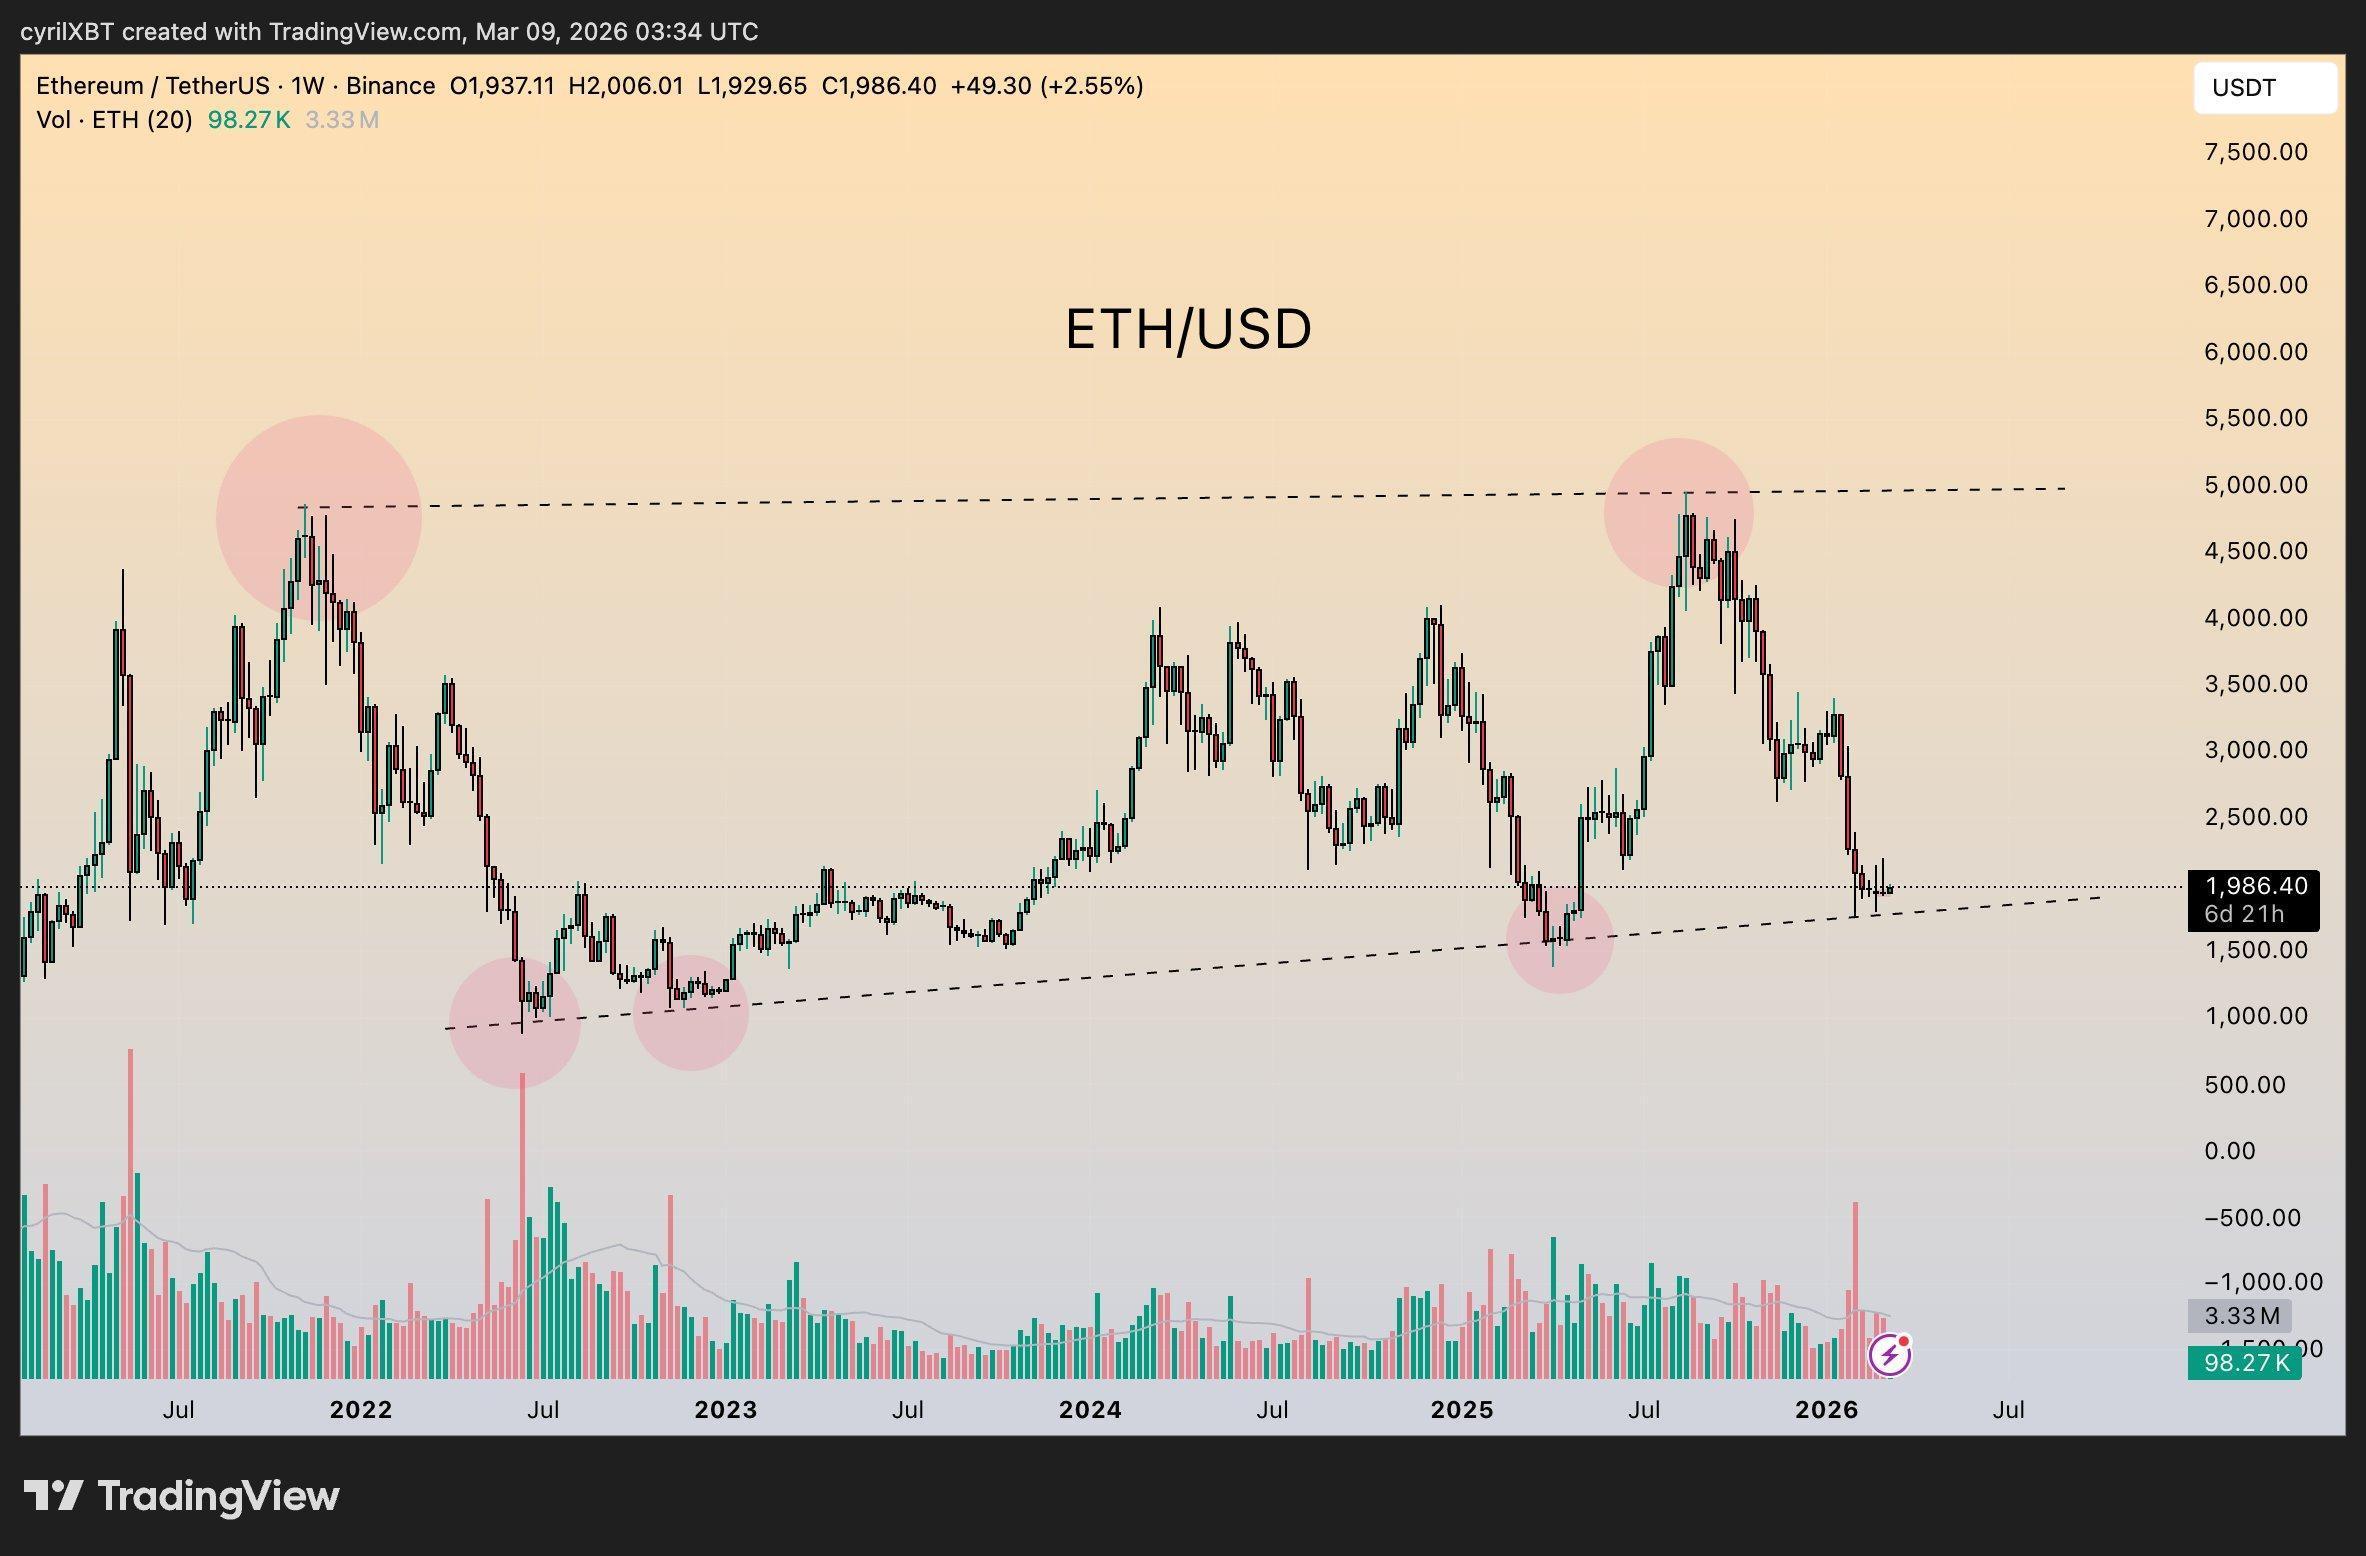
Crypto analyst Cyril-DeFi noted that ETH/USD is also testing a long-term ascending trendline that has supported the price several times since the last market cycle. The analyst said,
“Every time the price touched this support, it eventually led to a strong bounce. Right now, the $1.9k–$2k area looks like a key level that could determine the next move.”
Disclaimer: The content of this article solely reflects the author's opinion and does not represent the platform in any capacity. This article is not intended to serve as a reference for making investment decisions.
You may also like

Highlights from Day 2 of the Goldman Sachs TMT Conference: AI Moves from Concept to Commercialization; SanDisk Predicts Long-term Weakness in NAND Supply
On the second day of the Goldman Sachs Technology Conference, SanDisk provided a supply-side assessment for the storage industry: NAND supply growth is expected to remain constrained for the foreseeable future, while AI inference demand continues to expand, resulting in a long-term tight supply-demand balance. Meanwhile, companies such as Etsy, Booking.com, and Block disclosed tangible AI deployment progress in areas including matching and conversion, customer service, and infrastructure, demonstrating that AI is accelerating from a conceptual stage to measurable commercial returns.
The Great Debate on AI Bottlenecks: 2027 Peak Bottleneck vs 2028 Capacity Boom and Price Collapse
Analyst Ben Bajarin believes that the demand for AI computing power will continue to grow, and 2027 will be the "bottleneck" year with the most severe industry-wide supply constraints. In 2028, supply and demand are expected to remain slightly tight but balanced. Jay Goldberg, on the other hand, warns that the historical cycle's iron law suggests that massive production capacity from companies like TSMC could lead to a collapse in pricing power and a reversion of profit margins to the mean. Both agree that the era of "blindly buying into the AI supply chain and seeing instant surges" has ended, and investors must now carefully select core assets with resilience in cross-cycle pricing.
Crypto prices
More


