Bitget App
Trade smarter
Buy cryptoMarketsTradeFuturesEarnAISquareMore
XRP forms back-to-back bullish patterns: Is a $1.5 breakout close?

XRP forms back-to-back bullish patterns: Is a $1.5 breakout close?

AMBCryptoAMBCrypto2026/03/10 00:07
By:AMBCrypto

The market is still moving sideways, Bitcoin is still searching for a launchpad, but XRP is choosing the bulls.

Despite bullish signs, the wider market moved slowly. But XRP kept leaning bullish as both the chart and network activity tightened.

That kind of compression does not last forever. So the big question was simple: What was XRP preparing for?

XRP forms an Adam and Eve bottom

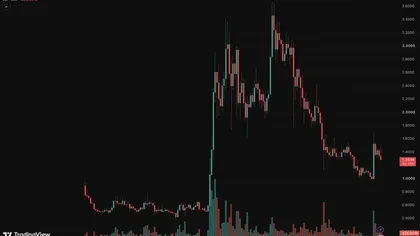
XRP [XRP] formed bullish back-to-back patterns—an Adam and Eve bottom inside a tightening ascending triangle—while price continued to respect ascending support during consolidation.

XRP forms back-to-back bullish patterns: Is a $1.5 breakout close? image 0

Source: TradingView

At the same time, MACD momentum indicators began turning slightly upward, strengthening the bullish setup. Meanwhile, the neckline stood near $1.5, and a break above it could confirm both patterns at once.

Whale accumulation strengthens

Whales aggressively bought the dip while XRP drifted between $1.3 and $1.5. Since the decline began, large players steadily stepped in. Selling pressure weakened as buyers absorbed liquidity.

However, the Average Spot Order Size gradually declined from late 2025 into early 2026.

XRP forms back-to-back bullish patterns: Is a $1.5 breakout close? image 1

Source: CryptoQuant

At first glance, smaller orders looked bearish. In reality, it hinted that heavy positioning already happened earlier.

Therefore, whales likely executed their largest trades before the recent compression phase began. As a result, XRP entered a quieter accumulation stage where price became easier to move upward.

Will XRP see a major explosion to the upside?

According to CryptoQuant data, activity on the XRP Ledger picked up again, with daily transactions nearing 2.5 million.

Notably, this marked a strong jump from recent monthly baselines. Network activity clearly accelerated again. Transaction volume rose sharply as on-chain usage picked up across the ledger.

XRP forms back-to-back bullish patterns: Is a $1.5 breakout close? image 2

Source: X

More importantly, Flare directly hinted that it may have played a role in the spike. In a post reacting to the transaction surge, Flare said,

“We might have something to do with that.”

It then added,

“And by we I mean @FlareNetworks and @XamanWallet ;)”

That comment suggested the spike may not have been random. Instead, part of the activity likely came from coordinated usage involving FlareNetworks and XamanWallet.

Real usage returned. Not speculation, not hype. Actual network movement increased, and XRP now has the fuel it needs for a bigger move.

Final Summary

  • XRP showed tightening bullish structure, whale accumulation, and accelerating XRP Ledger usage simultaneously.
  • If $1.5 breaks while $1.3 holds, XRP may exit consolidation violently.
0
0

Disclaimer: The content of this article solely reflects the author's opinion and does not represent the platform in any capacity. This article is not intended to serve as a reference for making investment decisions.

Understand the market, then trade.
Bitget offers one-stop trading for cryptocurrencies, stocks, and gold.
Trade now!

You may also like

The 5% U.S. Treasury yield storm is coming! The refinancing time bomb countdown begins—who will be the first victim?

The 10-year US Treasury yield has surpassed 5%, reaching a new high since 2007. The longer high interest rates persist, the greater the refinancing pressure will be on real estate companies, commercial real estate, and highly indebted firms, with systemic risks likely to accelerate and emerge within the next 12 to 18 months.

智通财经2026/09/16 06:36
The 5% U.S. Treasury yield storm is coming! The refinancing time bomb countdown begins—who will be the first victim?

Don't Fight the Profit Cycle! Will U.S. Stocks Break 8,000 Points This Year?

Jefferies predicts that, driven by the dual engines of the AI investment boom and stronger-than-expected corporate earnings, the S&P 500 index is expected to soar to 8,000 points by the end of 2026 and further reach 9,000 points in 2027. AI-driven profit expansion has spread from the "Magnificent Seven" to the entire market, with the S&P 500's EPS forecast to surge by 35% this year, far exceeding market consensus—marking the strongest earnings supercycle since 1995! The only real threat: if US Treasury yields continue to spike, the risk of valuation compression cannot be ignored.

华尔街见闻2026/09/16 06:26

Will “continual learning” AI extend the memory “shortage” until 2031?

Citi believes that as AI enters the era of "continuous learning" beyond simple training and inference stages, demand for HBM, server DDR5, and enterprise SSDs (eSSD) will experience explosive and simultaneous growth starting from 2027. While demand will surge rapidly, the supply side is constrained by HBM production capacity usage and slower technology migration, leading to expansion lagging far behind demand. This supply-demand imbalance is expected to continue until 2031.

华尔街见闻2026/09/16 06:16