
Bitcoin price analysis predicts another dip after $72K liquidity sweep

Bitcoin (BTC) price action liquidated shorts on Tuesday as market participants reacted to US President Donald Trump's comments on the Iran war.
Key takeaways:
Bitcoin order book liquidity is increasing as BTC price rebounds to $71,000.
Market participants anticipate a liquidity grab toward $72,000 next.
BTC price momentum improves, with rising spot volume and strong ETF inflows.
Liquidity clusters set up BTC price showdown
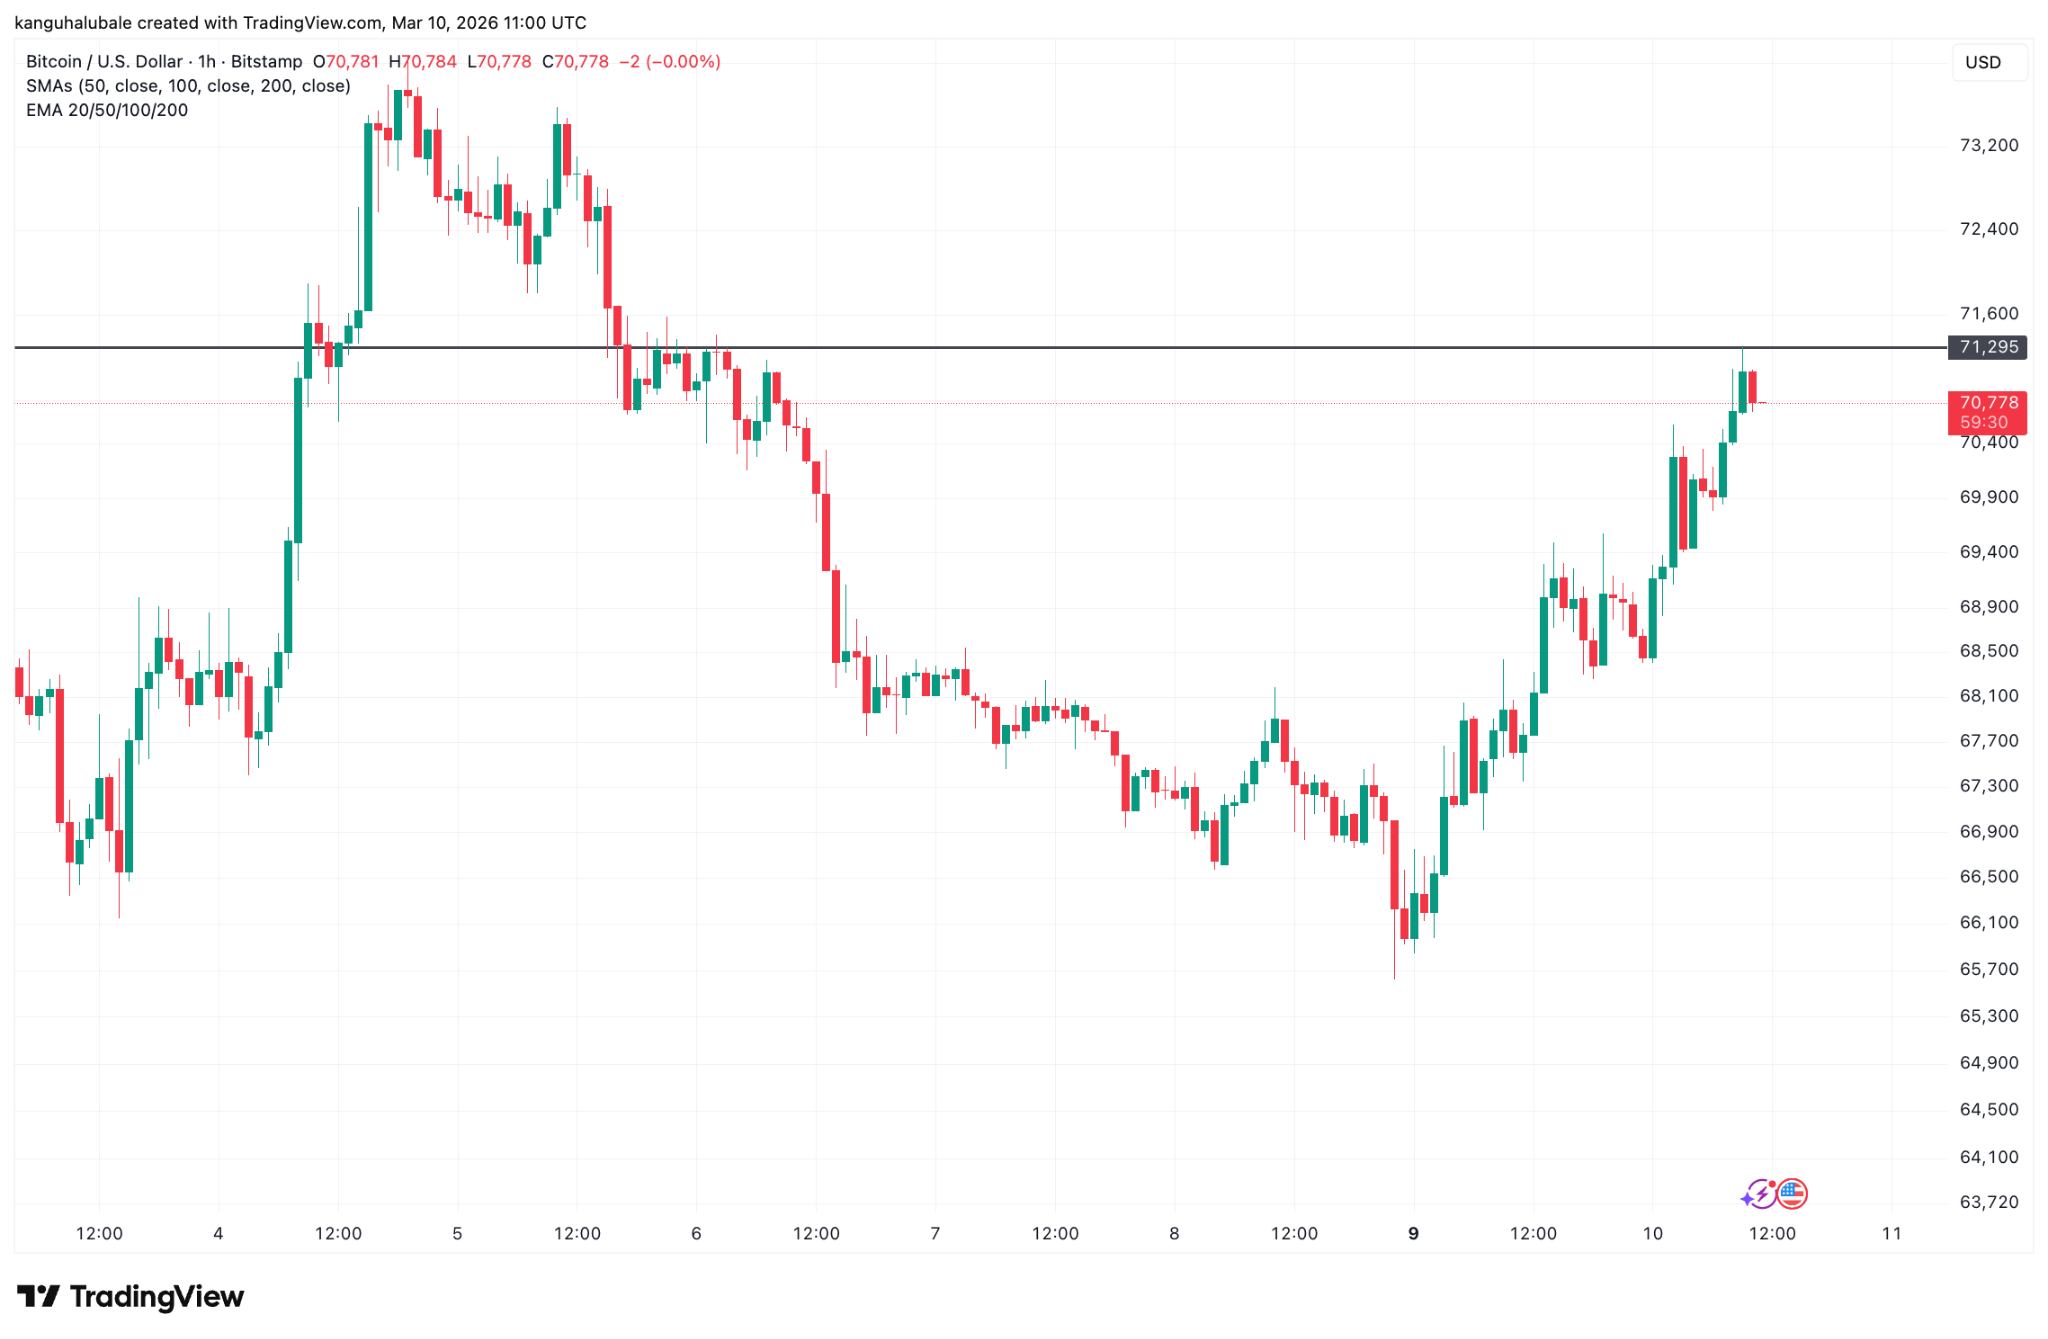
Data from TradingView showed BTC/USD hovering around $70,780 on Bitstamp, up 4.5% over the last 24 hours.
With BTC price recovering while liquidating shorts, orders were being stacked both above and below the spot price, setting the stage for the next liquidity grab.
“$BTC pumped above $70,000 yesterday, liquidating $186M shorts in the past 24 hours!” analysts at CryptoReviewing said in a Tuesday post on X.
Related: Will Bitcoin follow oil’s historic surge and rally to $79K before the end of March?
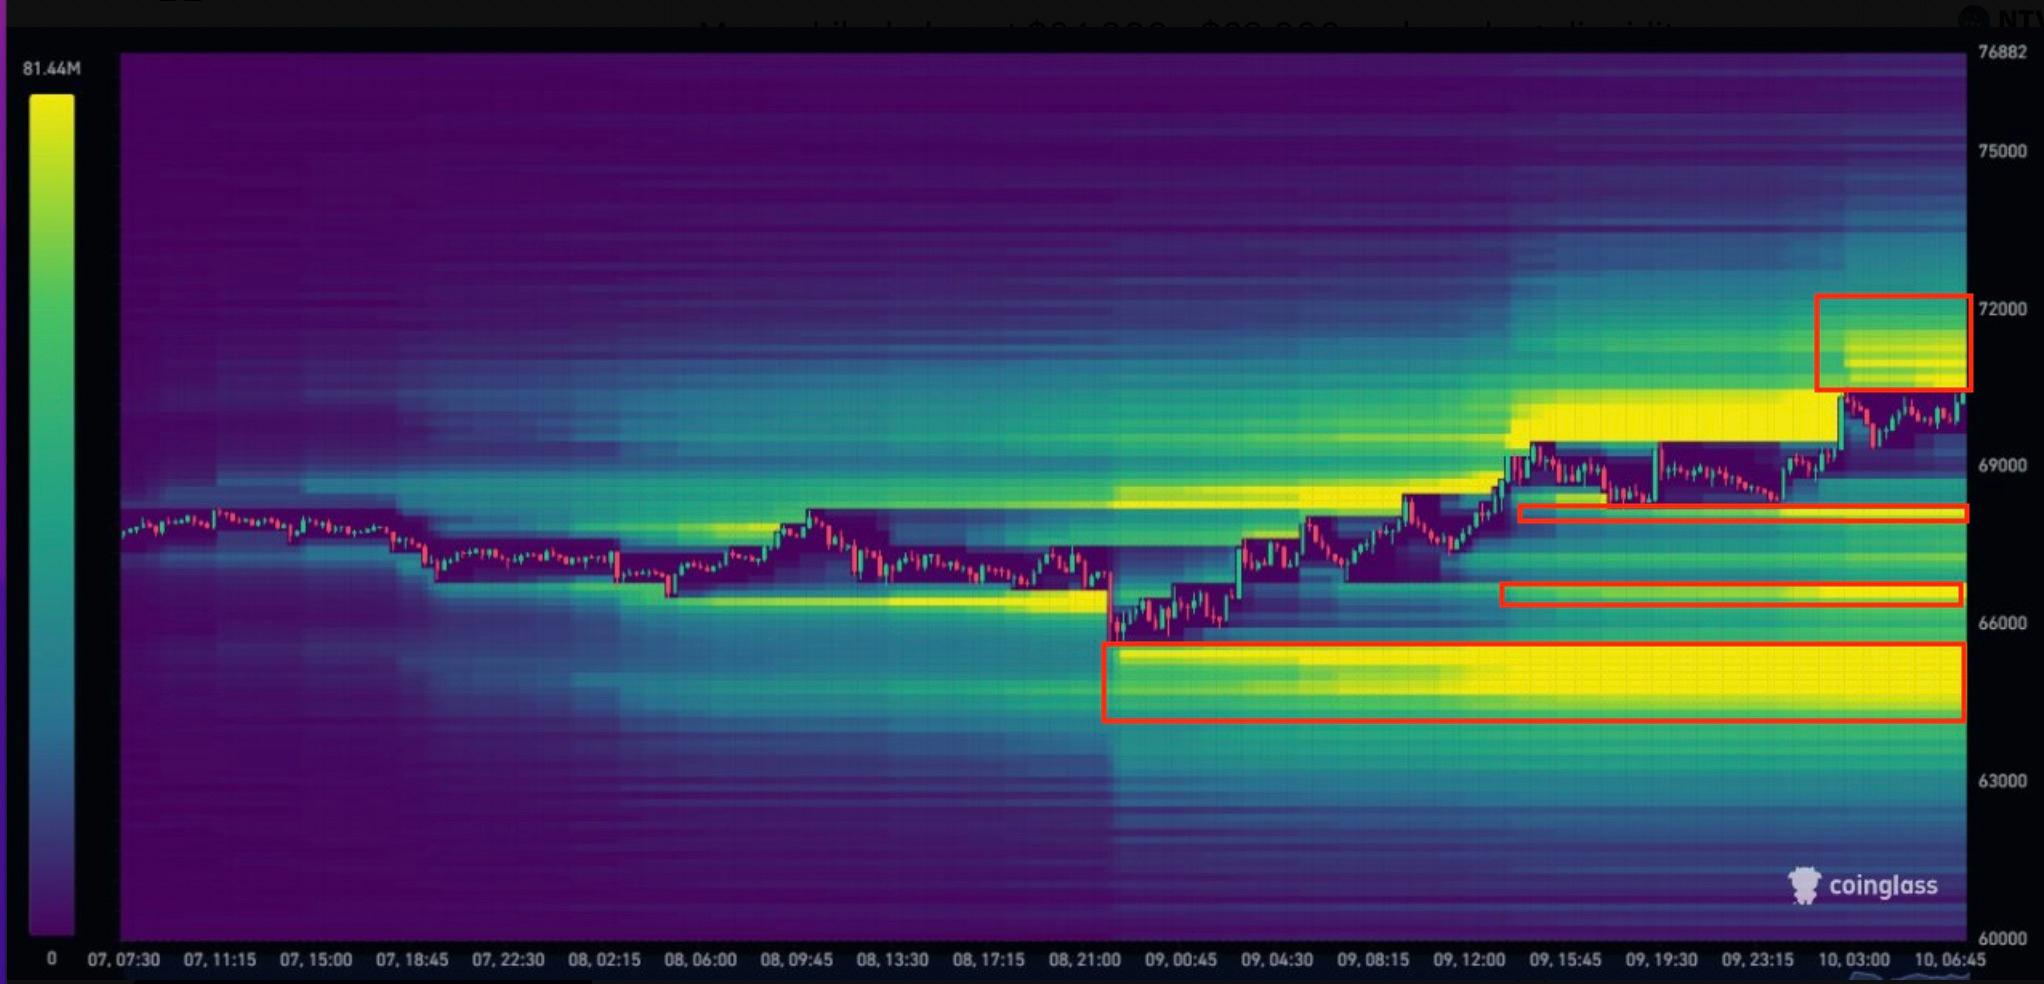
The liquidation heatmap shows that the $70,000-$72,000 supply zone has thinner liquidity that could easily be swept, potentially leading to the next big cluster at $74,000-$75,000.
However, with bigger clusters below, the price has a better chance of dipping below $70,000 after the $72,000 pocket gets filled.
“Meanwhile, below at $64,000-$68,000 we have large liquidity clusters, totalling roughly 4x more liquidity, making this the 'more likely' zone to visit next from a liquidity perspective,” the analysts said, adding:
“Bulls just applied the pressure.”
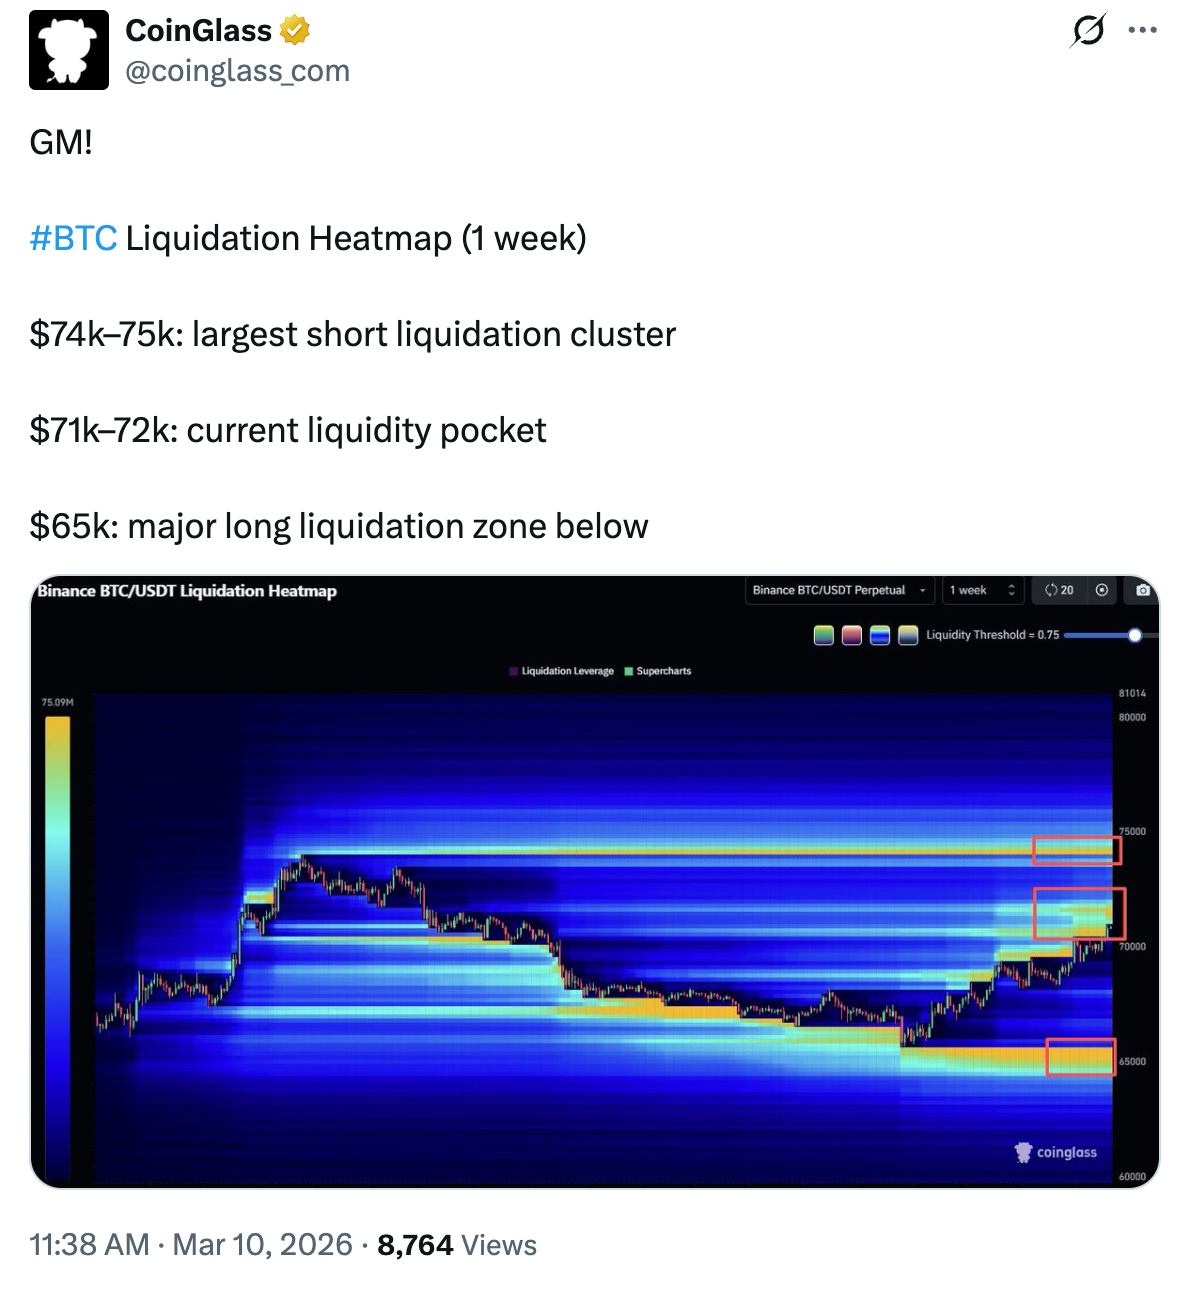
Zooming out, CoinGlass highlighted the “largest short liquidation cluster” sitting higher up between $74,000 and $75,000 on the weekly time frame.
Bitcoin price flashes “positive” recovery signals
Bitcoin price momentum has firmed over the past week, with the 14-day relative strength index (RSI) rising from the recent lows to 52 on Tuesday from 30 on March 1, according to data from Glassnode.
The rising RSI “signals a modest improvement in BTC momentum,” Glassnode said in its latest Weekly Market Pulse report, adding that the move higher “points to high buyer activity.”
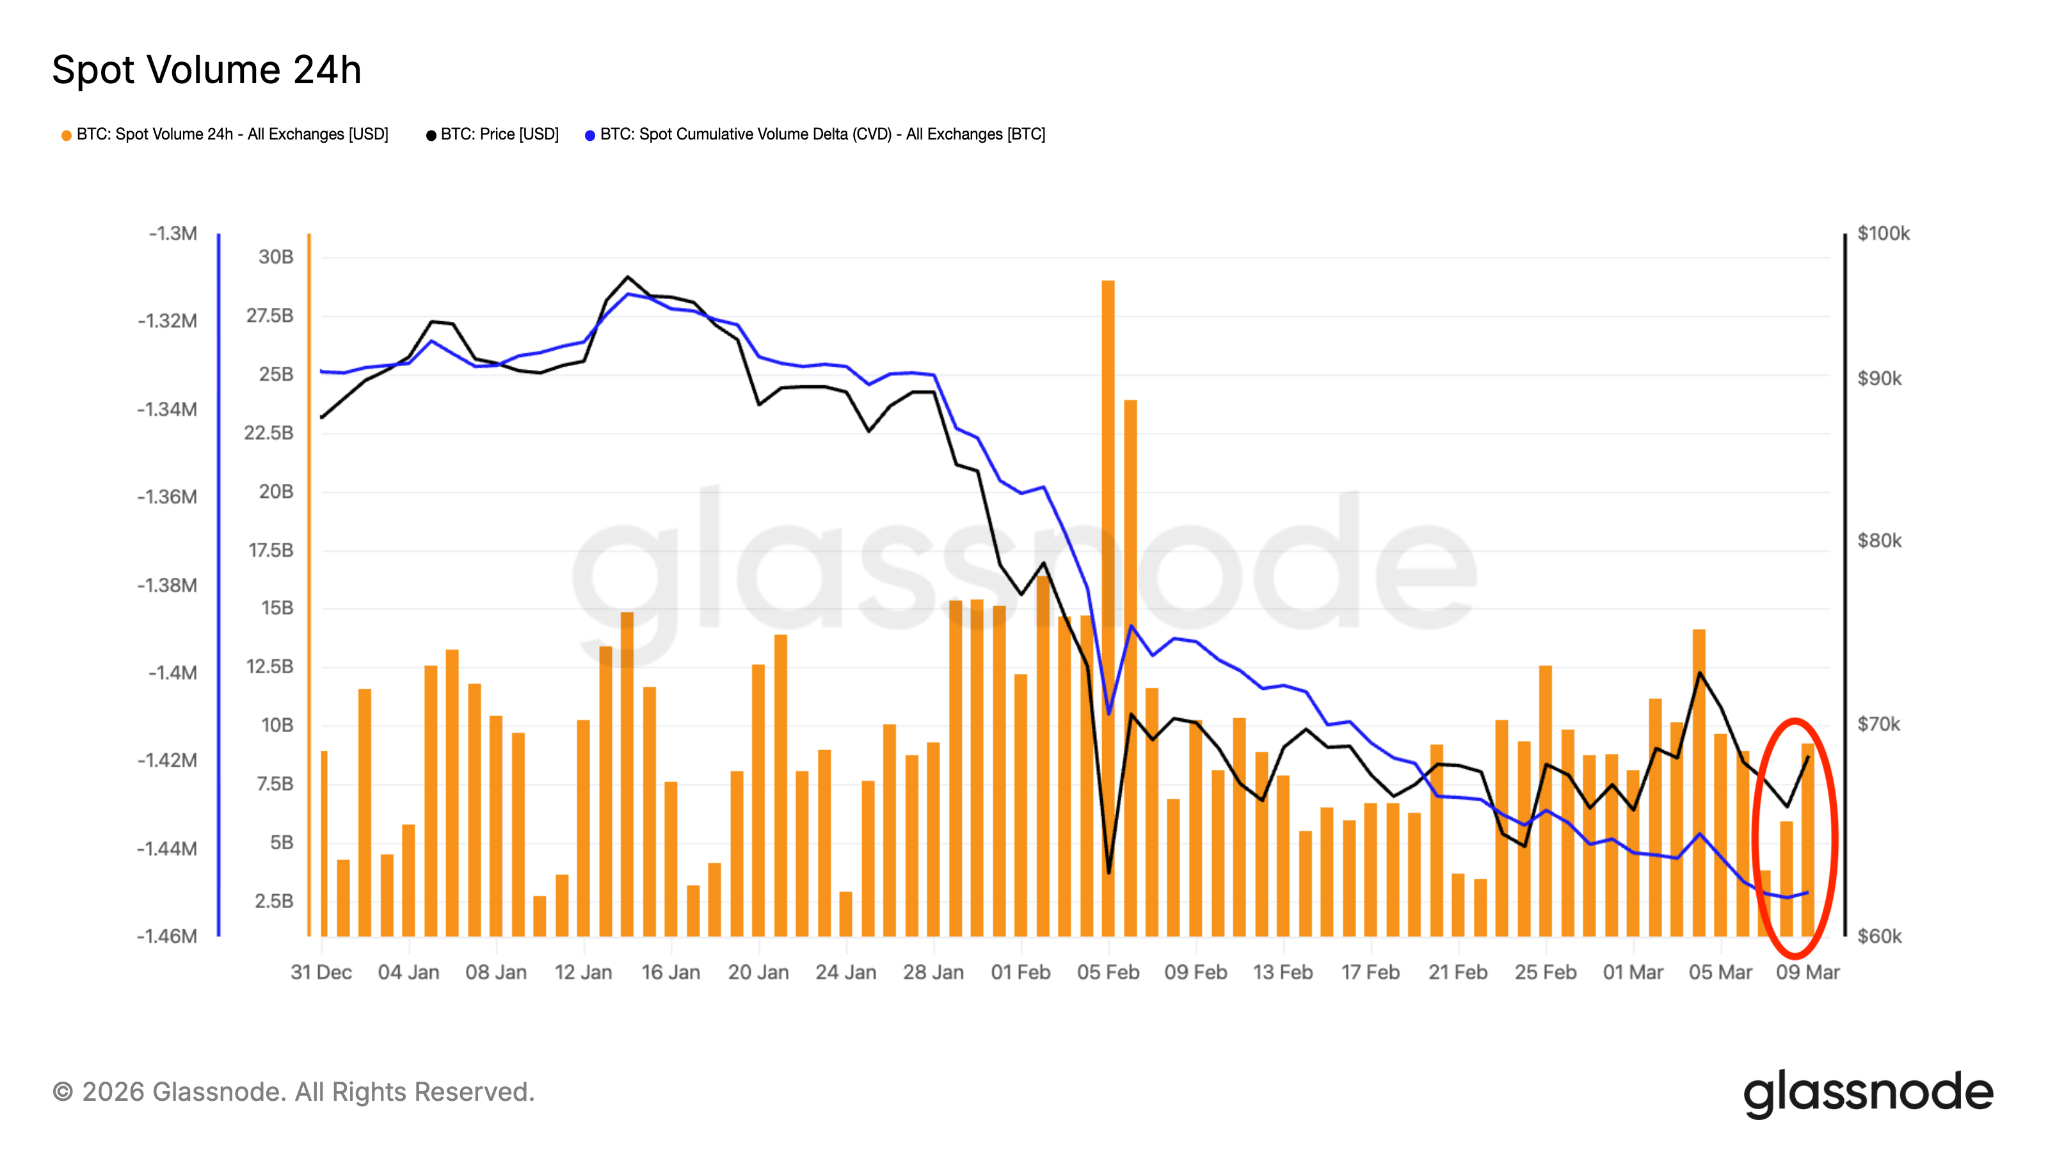
Spot demand is returning, with BTC trading volume rising to $9.3 billion at the time of writing from $3.38 billion on Saturday, a more than 140% increase.
Spot Bitcoin ETF activity remains a relative area of strength, with net inflows accelerating to $934 million, and trading volumes rose to $23.1 billion from $16 billion last week.
The strength of inflows “points to sustained institutional demand and continued traditional finance engagement,” Glassnode added.
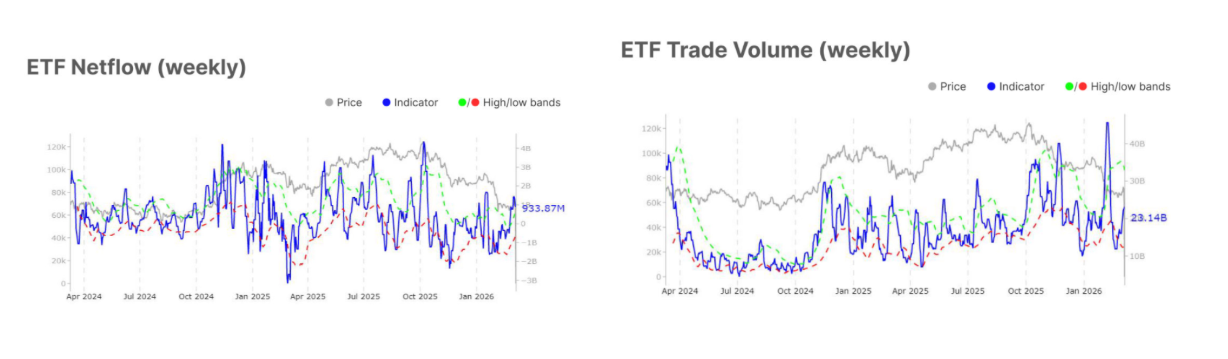
The demand for spot ETFs continued at the start of the week, with these investment products attracting $167 million in net inflows on Monday. Meanwhile, global Bitcoin investment products logged $521 million in net inflows, contributing to BTC’s upside momentum.
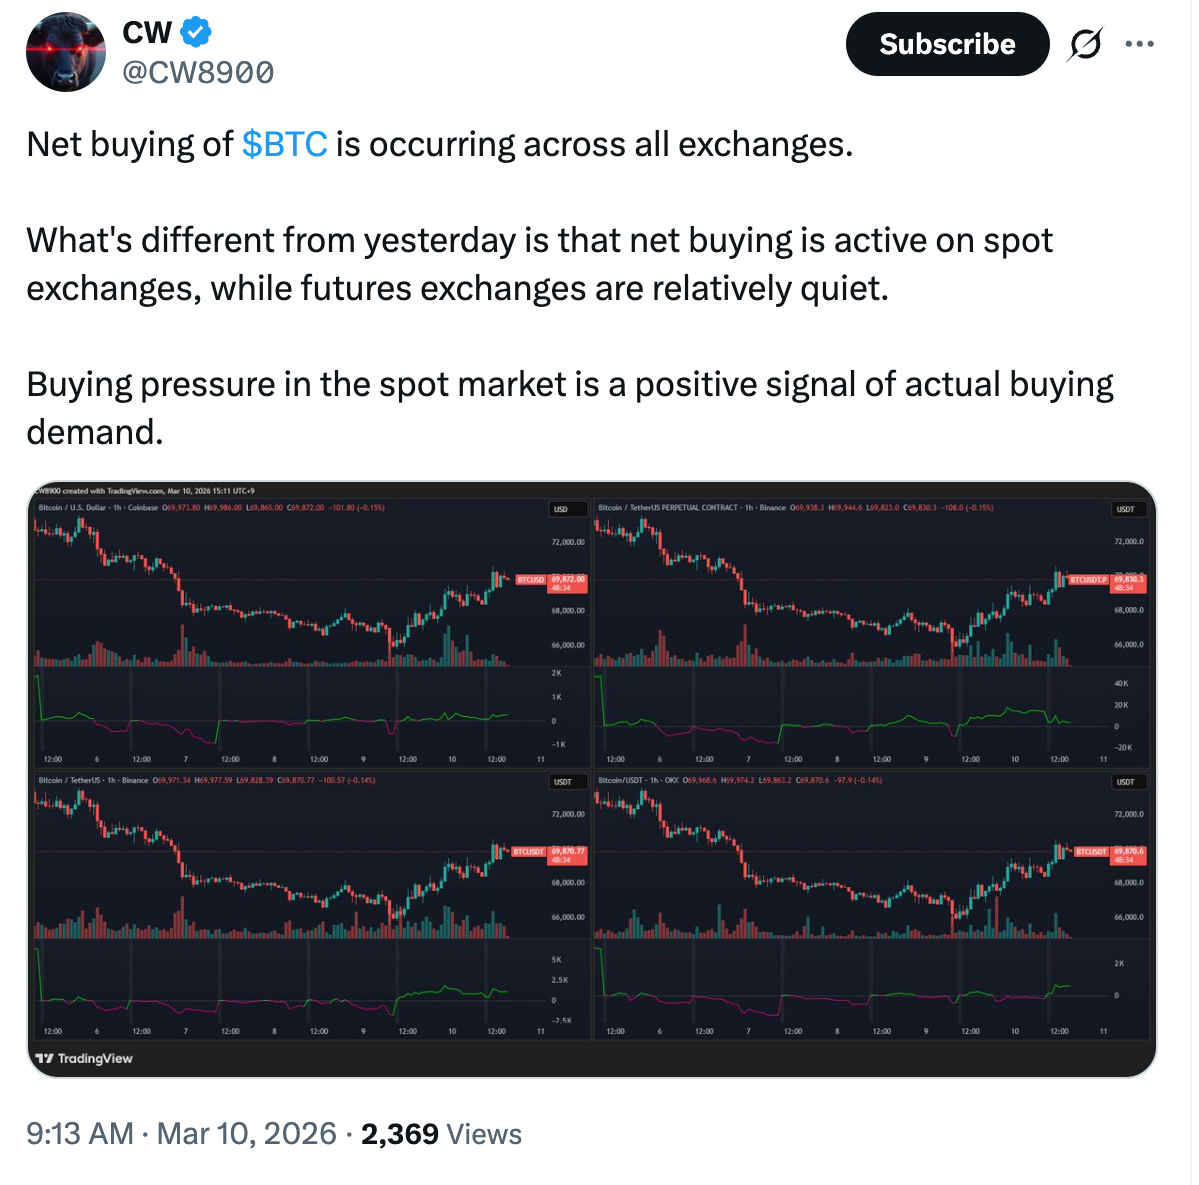
Crypto investor and analyst CW8900 said that “net buying” was occurring across all major exchanges, a “positive signal of actual buying demand.”
As Cointelegraph reported, Bitcoin ETFs recorded net positive inflows over the past 30 days while gold ETFs saw record outflows over the same period. This could be a sign that capital is rotating from gold into Bitcoin.
Disclaimer: The content of this article solely reflects the author's opinion and does not represent the platform in any capacity. This article is not intended to serve as a reference for making investment decisions.
You may also like

Novo Nordisk (NVO.US) renamed to "Novo" for a fresh start—Can multi-line breakthroughs dispel the shadow over its stock price?
Danish pharmaceutical company Novo Nordisk (NVO.US) has launched a comprehensive rebranding centered around the shorter name "Novo." The company will use "Novo" in daily brand promotion, but its legal name will remain Novo Nordisk A/S.

High interest rates are not the "end" of US stocks? Is profitability the real key?
JPMorgan believes that profit growth is the key factor determining the resilience of U.S. stock valuations. Data since 1950 shows an "inverted U-shaped" relationship between the 10-year U.S. Treasury yield and S&P 500 valuations. Based on current profit levels, yields would need to reach about 5%-6% to significantly compress valuations. As long as profit growth remains above 15%, there is still room for valuations to be re-rated. If the yield curve steepens in a bear market, cyclical sectors such as energy and financials will benefit more; if it flattens, technology stocks will have a relative advantage.
The "Outlier" Investment Art in the New Era of Berky

Crypto prices
More


