
Solana price hits 52-week low of $66 as bearish signals point to more downside

Solana price has dropped more than 27% over the past month and nearly 74% from its 2025 peak, with fresh ETF outflows and a crypto market rout sending the token to a 52-week low.
- Solana price hit a 52-week low of $66.6, down 27% in a month and 74% from its 2025 high.
- Crypto liquidations topped $1.66 billion, with long positions accounting for $1.42 billion.
- U.S. spot Solana ETFs posted $12.7 million in outflows, their first net redemption day since May.
According to data, Solana (SOL) price traded near $68 on June 4 after briefly touching a 52-week low of $66.6. The token was down roughly 17% on the day, 27% over the past month, and nearly 74% from its 2025 high near $258, as a wave of liquidations and risk-off sentiment swept through the crypto market.
Solana’s price downtrend intensified as the cryptocurrency market suffered another sharp sell-off, with Bitcoin slipping toward the $66,000 level and triggering a cascade of liquidations across leveraged positions.
Derivatives markets absorbed much of the damage. CoinGlass data shows more than $1.66 billion was liquidated from the crypto derivatives market over the past 24 hours, including roughly $1.42 billion in long positions. The wipeout forced bullish traders to close positions at market prices, adding fresh downside pressure across major altcoins.
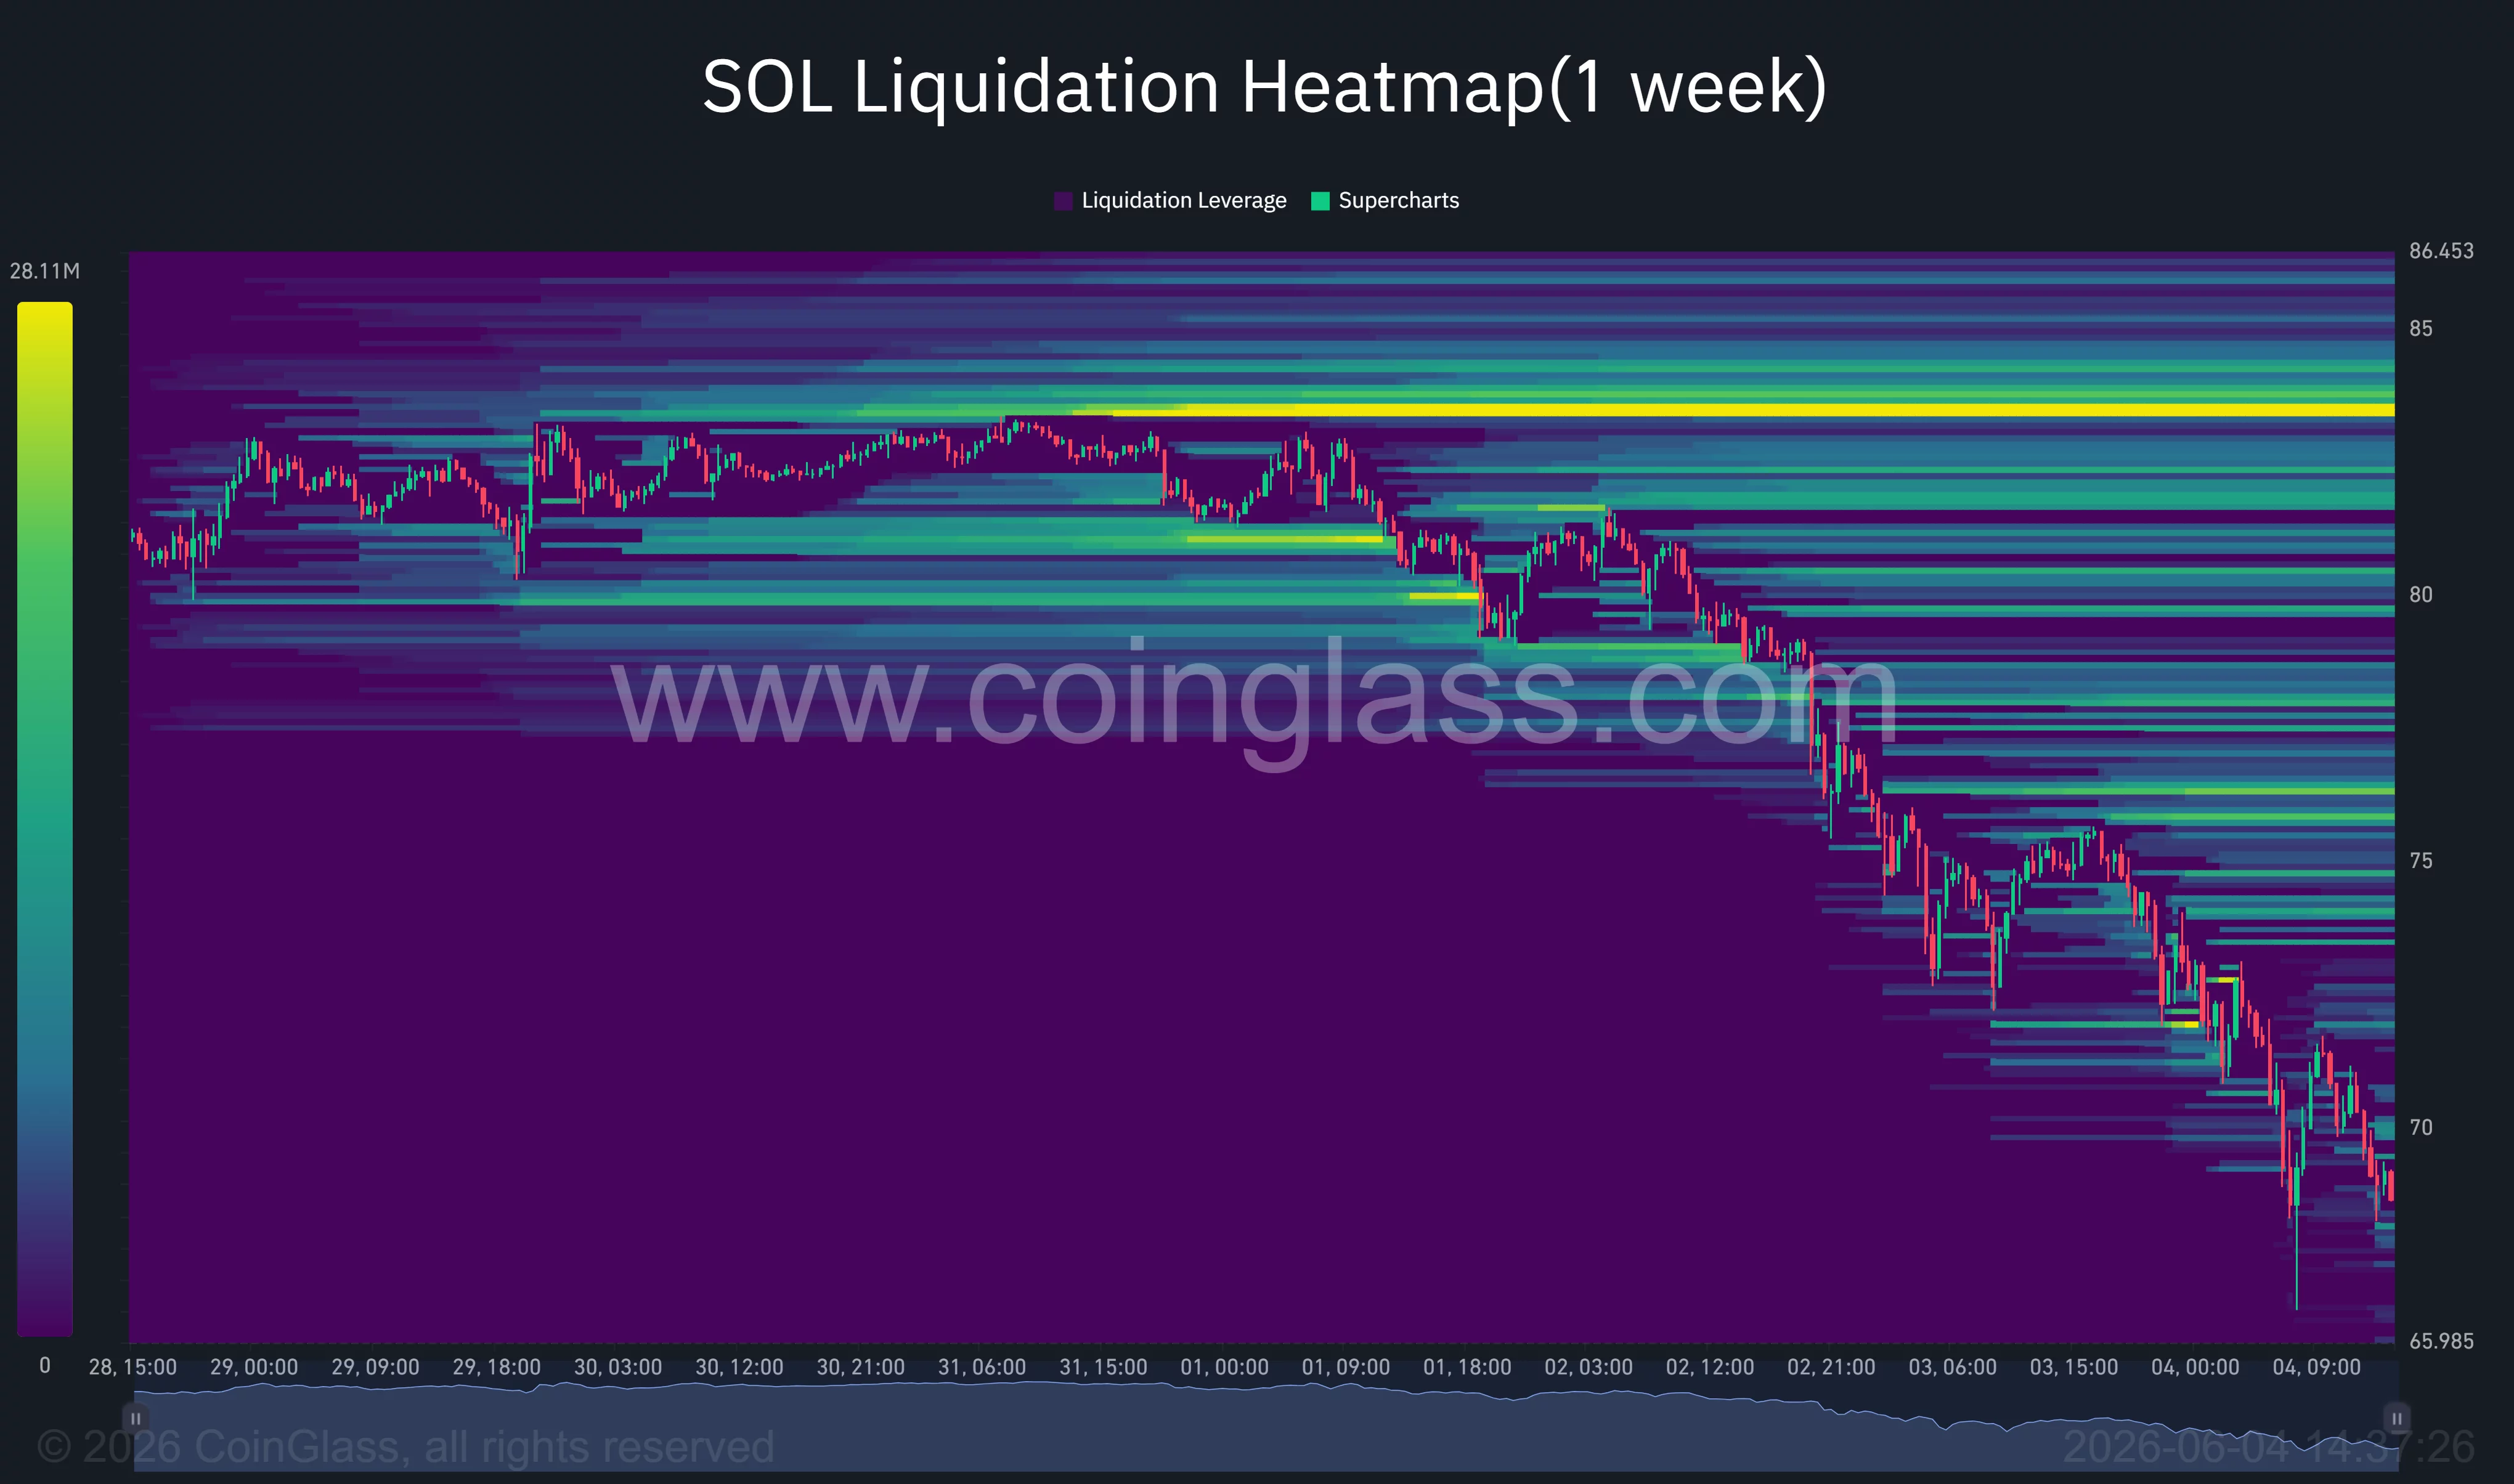 Solana liquidation heatmap | Source:
CoinGlass
Solana liquidation heatmap | Source:
CoinGlass
Solana price also fell as institutional sentiment for the token weakened this week. SoSoValue data shows that U.S. spot Solana ETFs recorded $12.7 million in net outflows on June 3, the first day of net redemptions since May. The withdrawal ended a period of steady inflows and arrived as investors reduced exposure to risk assets following the latest market downturn.
Outside crypto, geopolitical tensions in the Middle East continued to weigh on sentiment after renewed military activity increased demand for traditional safe-haven assets.
Rising oil prices and expectations that central banks could maintain restrictive policies for longer added another headwind for speculative markets.
Solana charts confirm a major technical breakdown
The weekly chart shows Solana breaking below the $76.6 support zone that had contained declines for several months. Sellers then pushed the token through the psychological $70 level before SOL price reached the $66.6 area, which now represents the most important near-term support on the chart.
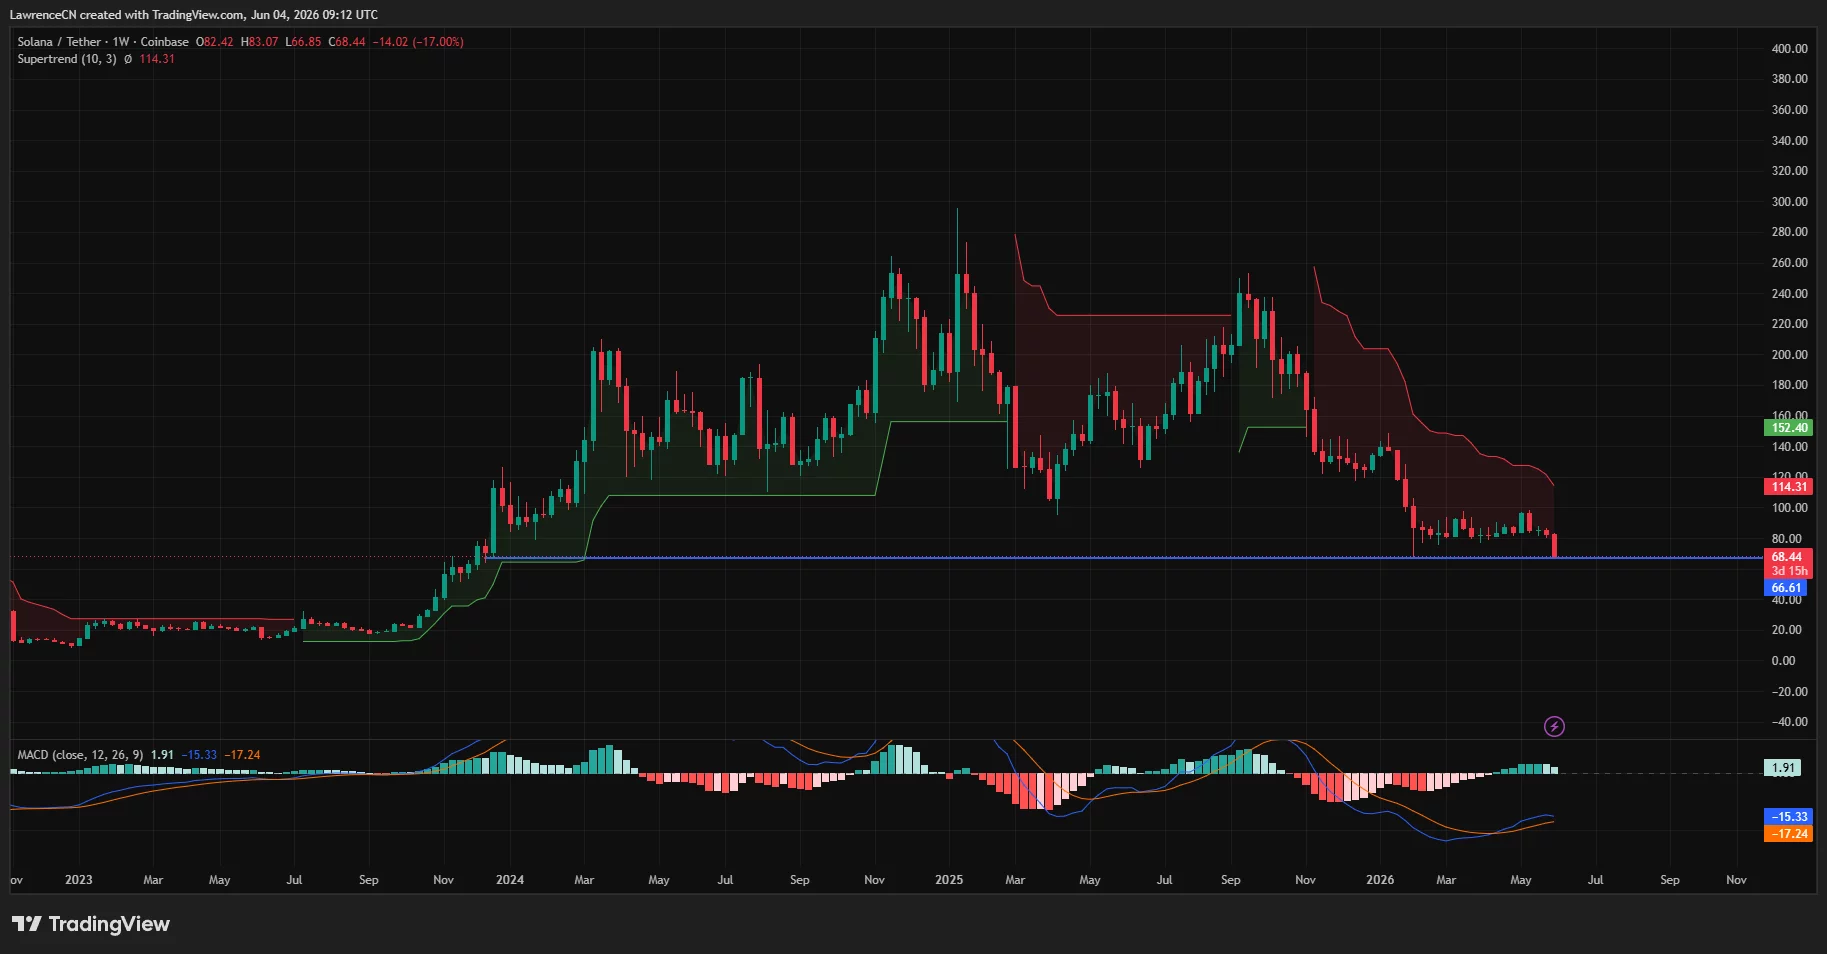 Solana price has lost a critical support level on the weekly chart — June 4 | Source:
crypto.news
Solana price has lost a critical support level on the weekly chart — June 4 | Source:
crypto.news
Technical indicators have deteriorated sharply. Solana remains below its Supertrend indicator, which currently sits near $114, leaving the long-term trend firmly bearish. Price also continues to trade well beneath major moving averages that had previously acted as support throughout 2025.
Momentum gauges offer little relief. The weekly MACD remains below the zero line, while both the MACD and signal lines continue to trend lower despite a slight reduction in bearish histogram strength. Until momentum indicators begin to reverse, sellers remain in control of the broader trend.
Looking at the liquidation data highlights where traders are focusing next. CoinGlass’ one-week liquidation heatmap shows a large concentration of leveraged positions clustered between $82 and $84. These levels could act as a magnet for price if a relief rally develops, although they also represent a significant resistance zone after the recent breakdown.
Commenting on the setup, analyst Jack Adams argued that Solana may not have reached its final low.
“I am almost certain $SOL is heading back to retest $67-$58 once more before reversing into $120-$175 this year.”
According to the analyst, previous monthly rejection zones suggest that the current decline is approaching an area where longer-term buyers could begin accumulating positions.
Downside risks remain elevated below key support levels
As of now, Solana price could see more downside ahead if the $66 support area fails to hold. A decisive breakdown would leave little historical support until the upper-$50 region, which coincides with the buy zone highlighted by several market technicians and roughly matches the measured move from the recent range breakdown.
At the same time, traders continue to monitor ETF flows and derivatives positioning for signs of stabilization. Continued fund outflows or another wave of long liquidations could accelerate downside momentum, particularly if Bitcoin extends its decline below nearby support levels.
Any meaningful recovery would likely require Solana to reclaim the former $76.6 support zone and force a move back toward the $82-$84 liquidity cluster. Until then, the technical structure remains bearish, with price trading at its lowest level in a year and sellers retaining control of the market.
Disclaimer: The content of this article solely reflects the author's opinion and does not represent the platform in any capacity. This article is not intended to serve as a reference for making investment decisions.
You may also like
Balancer eyes wind-down after restructuring fails to revive revenue
Is a new wave of sell-offs approaching? The ultimate rival of the AI bull market emerges—The "global anchor of asset pricing" breaks through the 5% super threshold
After the 10-year US Treasury yield breaks back above the critical 5% mark, it is more likely to usher in a period of high-level tug-of-war and accelerated asset differentiation. Especially before energy shocks and the significantly eased large-scale expansion of the US fiscal deficit, the conditions to quickly replicate the sharp yield decline seen at the end of 2023 are not yet fully in place.

Anthropic releases another article: What will the economy look like in the AI era?
Anthropic's economics team has released an AI economic scenario model, centered around three scenarios: moderate and gradual growth, transformative changes with GDP doubling, and an extreme situation with 15% annual growth but massive job losses among knowledge workers. The model treats work as "bundles of tasks" and analyzes AI’s enhancement and substitution effects on different types of tasks. Anthropic emphasizes that the economic outlook for 2030 is not predetermined; the key lies in how the dividends from AI are widely shared.
"New Federal Reserve News Agency": Waller's Rate Hike "Has No Way Back", Trump's "Trust" Faces Test
Nick Timiraos believes that after the higher-than-expected August CPI, the probability of the Federal Reserve raising interest rates this week has surged, while Waller’s hawkish stance on inflation has left himself almost "no leeway." With seven weeks before the election, whether or not Waller raises rates will directly test how long Trump's “trust” in him can last. Previously, Waller maintained a balance between the White House and the Federal Reserve by “talking less and avoiding provocation,” but after this meeting, silence will no longer serve as his shield.
Crypto prices
More


