coinedition.com
Dogecoin trades at $0.0827 on June 5, down 6.45% after breaking below the ascending channel that contained price since February, as Ali Charts’ $0.0883 target is reached and attention turns to whether $0.067 becomes the next destination.
$DOGE Daily Chart: Ascending Channel Breaks With RSI at 20 and Three FVG Zones Overhead
 $DOGE/USD Daily SMC Structure and Fibonacci (Source: TradingView)
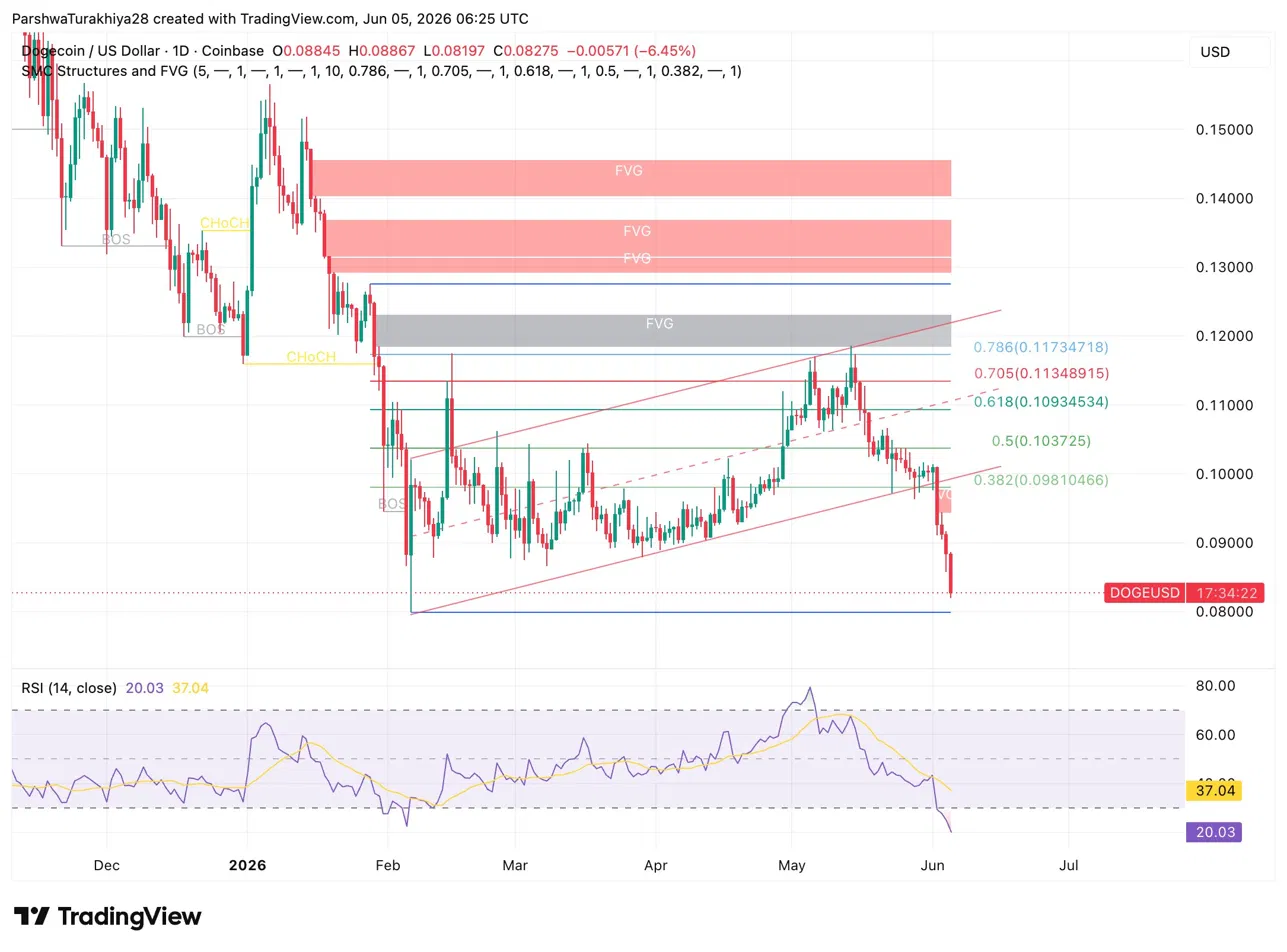
The ascending channel that ran from the February low near $0.070 through the May high near $0.120 has broken to the downside. The breakdown candle cut through the 0.382 Fibonacci support at $0.09810, with the channel lower trendline now acting as resistance on any recovery attempt rather than support.
Three FVG zones sit overhead between $0.113 and $0.150, all of which need to be reclaimed before any meaningful recovery develops. The Fibonacci structure shows the 0.5 at $0.10372, the 0.618 at $0.10934, the 0.705 at $0.11348, and the 0.786 at $0.11734 as the recovery targets in ascending order. Below current price the blue horizontal support near $0.080 is the only visible daily structure.
Related: Siren ($SIREN) Price Prediction 2026-2050: Will $SIREN Hit $1.5 Soon?
The RSI at 20.03 is deep in oversold territory with the signal line at 37.04 well above it, confirming the severity of the sell-off. A reading this low historically precedes mean reversion bounces but does not guarantee them in sustained downtrends.
Key levels:
- Resistance: $0.09810 (0.382 Fib), $0.10372 (0.5 Fib), $0.113 (FVG base)
- Support: $0.0820 (current low), $0.0800 (horizontal structure), $0.067 (Ali Charts next target)
$DOGE 30-Minute Chart: VWAP and MACD Both Bearish With No Intraday Bounce Structure
 $DOGE/USD 30-Minute VWAP and MACD (Source: TradingView)
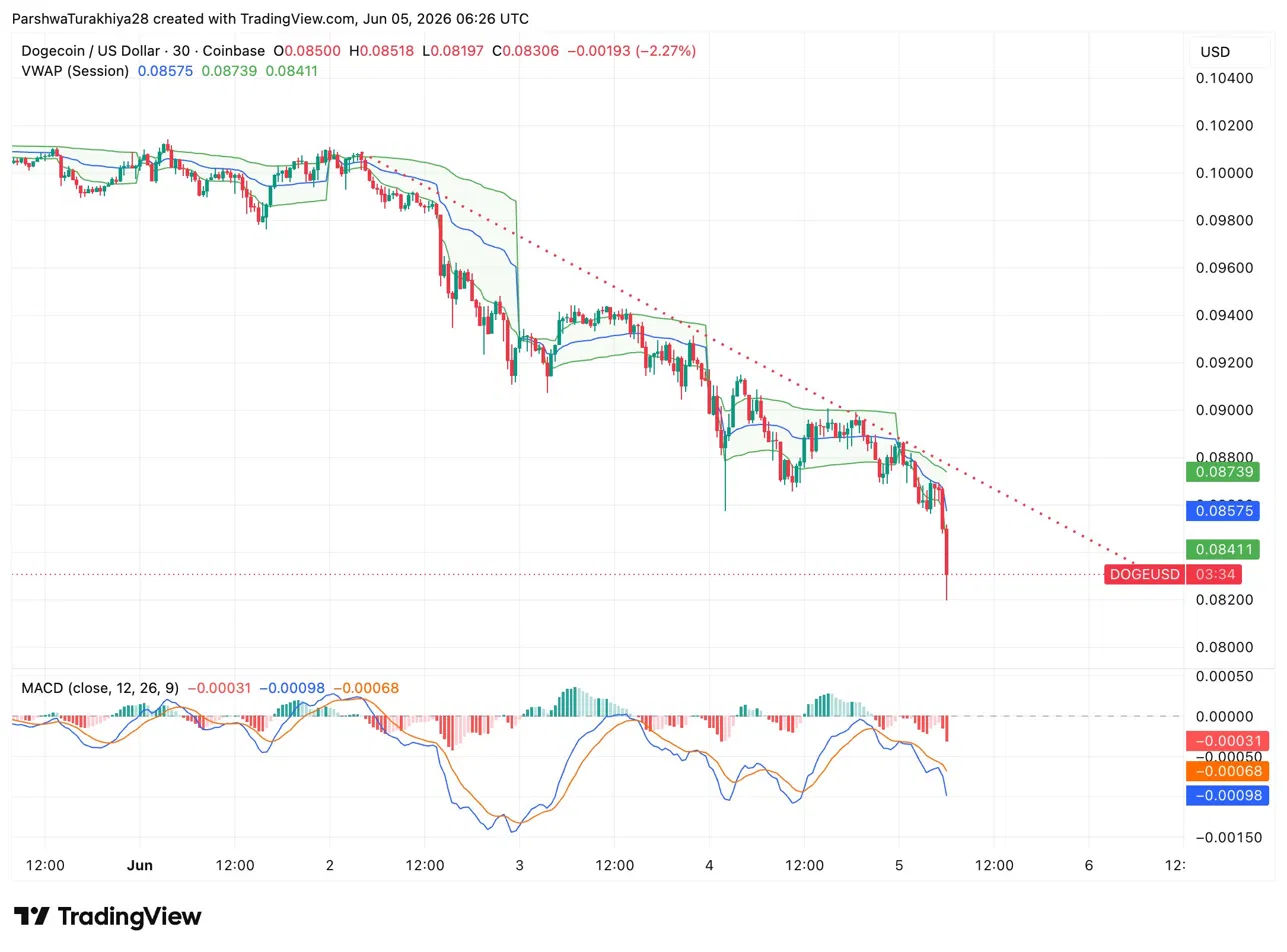
The 30-minute chart shows a clean descending structure from the June 1 high near $0.101 through to the current level at $0.0830. The VWAP sits at $0.08575 with the upper band at $0.08739 and the lower at $0.08411. Price is trading below the VWAP midline, confirming intraday sellers are in control of the session.
The MACD on the 30-minute is bearish with the line at -0.00098 and the signal at -0.00068, both below zero and diverging further. The dotted descending resistance trendline has capped every intraday recovery attempt since June 2. A 30-minute close above the VWAP at $0.08575 is the minimum requirement before any intraday bounce becomes tradeable.
What Ali Charts Said and What It Means Now
Dogecoin $DOGE reached my $0.0883 target. ✔️
— Ali Charts (@alicharts) June 5, 2026
The lower boundary of the channel is now being tested. As long as this support holds, I think a recovery toward $0.1019 and $0.1156 remains likely.
A breakdown, however, could expose the next major supply zone near $0.067 pic.twitter.com/rbpiw44xM3
Ali Charts posted that $DOGE has reached the $0.0883 downside target and is now testing the lower boundary of the channel. His view is that as long as support holds, a recovery toward $0.1019 and $0.1156 remains likely.
Related: Bitway Price Prediction: BTW Surges Over 220% as Bulls Target $0.05
A breakdown of the channel lower boundary, which the current price action suggests is already underway, exposes the next major supply zone near $0.067.
$DOGE Derivatives and Spot: Hedging Picks Up as Spot Exits Accelerate
 $DOGE Derivative Analysis (Source: Coinglass)
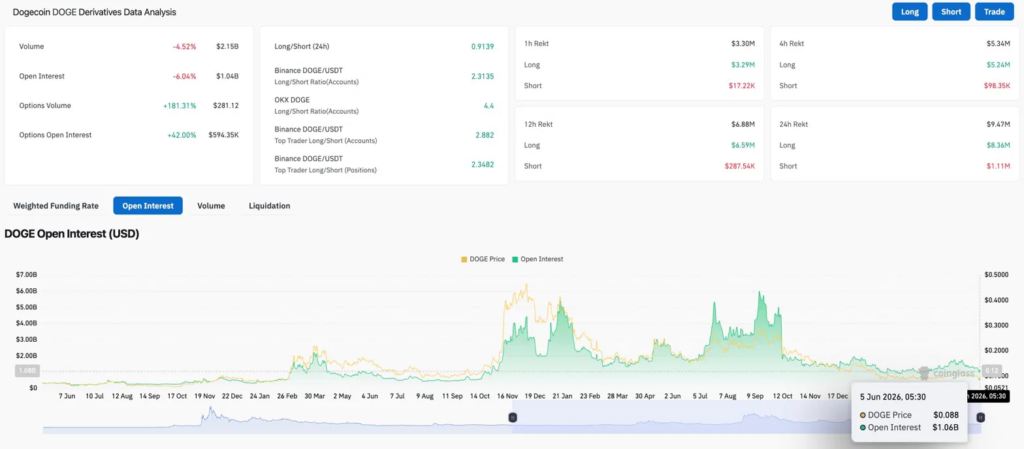
Futures volume fell 4.52% to $2.15B while open interest dropped 6.04% to $1.04B. Both falling together as price drops means traders are closing positions rather than building fresh shorts. Longs absorbed $8.36M in liquidations against just $1.11M for shorts over 24 hours.
The retail long/short ratio on Binance sits at 2.3135 with top traders at 2.882, both net long heading into a breakdown. That is a large pool of uncleared long positions that adds downside fuel if $0.08 fails.
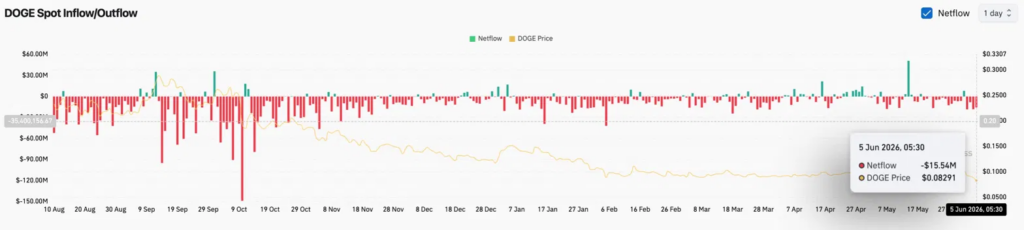 $DOGE Netflows (Source: Coinglass)
Options volume surging 181.31% while futures OI falls points to traders buying put protection on existing longs rather than shorting outright. Spot netflow hit negative $15.54M on June 5, one of the larger single-day exit readings in recent weeks, confirming real holders are selling at current prices.
$DOGE Price Prediction for June 6
- Downside: A daily close below $0.0800 confirms the channel breakdown and opens Ali Charts’ $0.067 target as the next destination with no structural support between the two levels.
- Upside: Holding $0.0820 and reclaiming the VWAP at $0.08575 on the 30-minute opens a move toward the 0.382 Fib at $0.09810 and Ali Charts’ recovery targets of $0.1019 and $0.1156.
Related: Cardano Price Prediction: ADA Hits 5.5-Year Lows As Hoskinson Takes a Break