Bitget App
Trade smarter
Buy cryptoMarketsTradeFuturesEarnAISquareMore
Did XRP Just Print the Exact Same 2024 Falling Wedge Pattern Seen Before a 600% Explosion?

Did XRP Just Print the Exact Same 2024 Falling Wedge Pattern Seen Before a 600% Explosion?

CryptoNewsNetCryptoNewsNet2026/06/05 20:27
By:CryptoNewsNet
Back to the list

Did XRP Just Print the Exact Same 2024 Falling Wedge Pattern Seen Before a 600% Explosion?

Did XRP Just Print the Exact Same 2024 Falling Wedge Pattern Seen Before a 600% Explosion? image 0  thecryptobasic.com 21 m
Did XRP Just Print the Exact Same 2024 Falling Wedge Pattern Seen Before a 600% Explosion? image 1

Crypto YouTuber Blacksea has highlighted an $XRP chart pattern he believes closely resembles a previous explosive move.

In a tweet, Blacksea argued that $XRP has formed a falling wedge pattern similar to the one seen in late 2024. That setup preceded a surge of roughly 600%.

Sharing side-by-side charts, the analyst pointed to several similarities, including a prolonged downtrend, multiple lower highs, and a wedge breakout. From November 2024, $XRP moved from $0.50 to $3.30 by January, marking a nearly 7x surge in just two months.

“Nobody is talking about this,” Blacksea wrote on X. He argued that the current setup closely mirrors the pattern that preceded $XRP’s explosive rally last year.

Key Points

  • $XRP analyst Blacksea spots a falling wedge mirroring the 2024 setup that preceded a 600% price surge.
  • $XRP rose from $0.50 to $3.30 after the breakout, a nearly 7x move within just two months last cycle.
  • The current $XRP price has dropped ~70% from the $3.65 peak and now trades near $1.10 under pressure.
  • Analysts split as some see a repeat pattern, others say market conditions are too different this time.

History Rhyming for $XRP

The comparison focuses on $XRP’s price action within a descending wedge formation. Blacksea’s chart suggests $XRP may be following a path similar to its previous cycle. The setup includes several consolidation phases before a steep upward move.

In the current case, $XRP has dropped about 70% from its previous peak of $3.65 over the last ten months. The coin is now trading around $1.10 amid an ongoing decline, with risk of further downside if key levels break.

The pattern formed over this nearly one-year period is being interpreted by Blacksea as a historically bullish structure.

However, the analyst acknowledged that history does not always repeat itself. He noted that similar market structures can sometimes lead to similar outcomes, but are not guarantees.

He also argued that investors who enter early and manage risk effectively are often best positioned to benefit if the pattern plays out as expected.
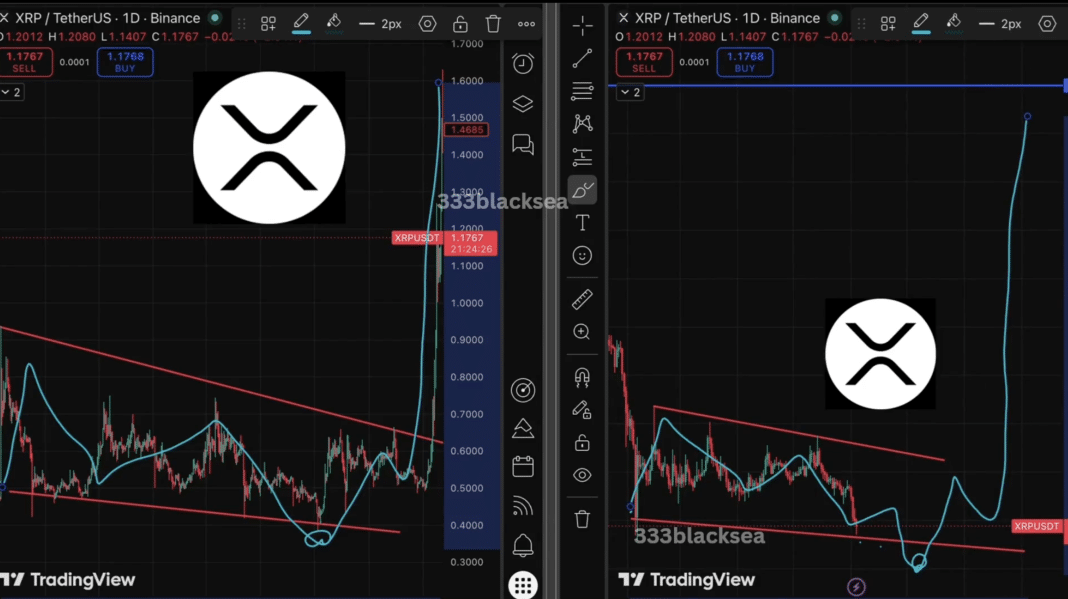
Did XRP Just Print the Exact Same 2024 Falling Wedge Pattern Seen Before a 600% Explosion? image 2 Blacksea’s $XRP chart

$XRP Under Pressure After Losing Key Support

The bullish comparison comes as $XRP faces notable short-term weakness. According to CoinMarketCap data, $XRP fell 6.09% over the past 24 hours, trading around $1.11. The decline pushed the cryptocurrency below the key $1.20–$1.28 support zone, which had largely defined $XRP’s trading range since February.

The breakdown occurred amid a broader crypto market selloff. Over the same period, Bitcoin dropped about 16% to roughly $62,100, after previously trading above $70,000 earlier in the week.

Community View

While some see the ongoing dip as a buying opportunity, others disagree with Blacksea’s view that another 600% price rally may follow. X user Mohamed Zorro remarked that past patterns are not necessarily predictive of the future.

Similarly, X user Virachocha noted that conditions from nine years ago and today are no longer the same. In other words, factors that helped $XRP surge in 2024 may no longer be present, with the asset now facing a different market reality.

At the time, former SEC Chair Gary Gensler announced his resignation, and pro-crypto President Donald Trump had just been elected. This environment was broadly bullish for crypto, and assets like $XRP benefited from it.

In the current case, the market is overwhelmingly bearish, with the fear index below 20. Earlier in February, it dipped to 5 before recovering slightly, but fear has returned as Bitcoin remains significantly below its recent highs.

0
0

Disclaimer: The content of this article solely reflects the author's opinion and does not represent the platform in any capacity. This article is not intended to serve as a reference for making investment decisions.

Understand the market, then trade.
Bitget offers one-stop trading for cryptocurrencies, stocks, and gold.
Trade now!

You may also like

Is a new wave of sell-offs approaching? The ultimate rival of the AI bull market emerges—The "global anchor of asset pricing" breaks through the 5% super threshold

After the 10-year US Treasury yield breaks back above the critical 5% mark, it is more likely to usher in a period of high-level tug-of-war and accelerated asset differentiation. Especially before energy shocks and the significantly eased large-scale expansion of the US fiscal deficit, the conditions to quickly replicate the sharp yield decline seen at the end of 2023 are not yet fully in place.

智通财经2026/09/15 03:26
Is a new wave of sell-offs approaching? The ultimate rival of the AI bull market emerges—The "global anchor of asset pricing" breaks through the 5% super threshold

Anthropic releases another article: What will the economy look like in the AI era?

Anthropic's economics team has released an AI economic scenario model, centered around three scenarios: moderate and gradual growth, transformative changes with GDP doubling, and an extreme situation with 15% annual growth but massive job losses among knowledge workers. The model treats work as "bundles of tasks" and analyzes AI’s enhancement and substitution effects on different types of tasks. Anthropic emphasizes that the economic outlook for 2030 is not predetermined; the key lies in how the dividends from AI are widely shared.

华尔街见闻2026/09/15 03:26

"New Federal Reserve News Agency": Waller's Rate Hike "Has No Way Back", Trump's "Trust" Faces Test

Nick Timiraos believes that after the higher-than-expected August CPI, the probability of the Federal Reserve raising interest rates this week has surged, while Waller’s hawkish stance on inflation has left himself almost "no leeway." With seven weeks before the election, whether or not Waller raises rates will directly test how long Trump's “trust” in him can last. Previously, Waller maintained a balance between the White House and the Federal Reserve by “talking less and avoiding provocation,” but after this meeting, silence will no longer serve as his shield.

华尔街见闻2026/09/15 03:26

Trump Opposes AI "Guardrails": Congress Pushes Legislation for Restrictions, Deepening Bipartisan Divide

U.S. President Trump opposes setting guardrails for artificial intelligence (AI), putting him at odds with a growing number of bipartisan lawmakers. As the midterm elections approach, voters' concerns about AI safety have intensified their doubts about this technology.

智通财经2026/09/15 02:46
Trump Opposes AI "Guardrails": Congress Pushes Legislation for Restrictions, Deepening Bipartisan Divide