

 u.today
As price action and on-chain data start to show red flags, $XRP is coming under increasing pressure.
The asset is currently trading close to $1.20, continuing a bearish trend that has dominated much of 2026 after breaking below a significant multi-month support zone around $1.30.
$XRP's activity pushed higher
The $XRP Ledger has seen an increase in activity concurrently. Payment volume between accounts, which recently surpassed 746 million $XRP, is one of the most noteworthy metrics. This activity comes after an even bigger spike in transactions, close to 1.5 billion $XRP, that occurred only a few days prior. Additionally, payment counts have continued to be high, hovering around one million transactions per day.
Such an increase in network activity might seem bullish at first. Higher transaction volumes frequently indicate increased adoption and greater utility. Context, however, matters.
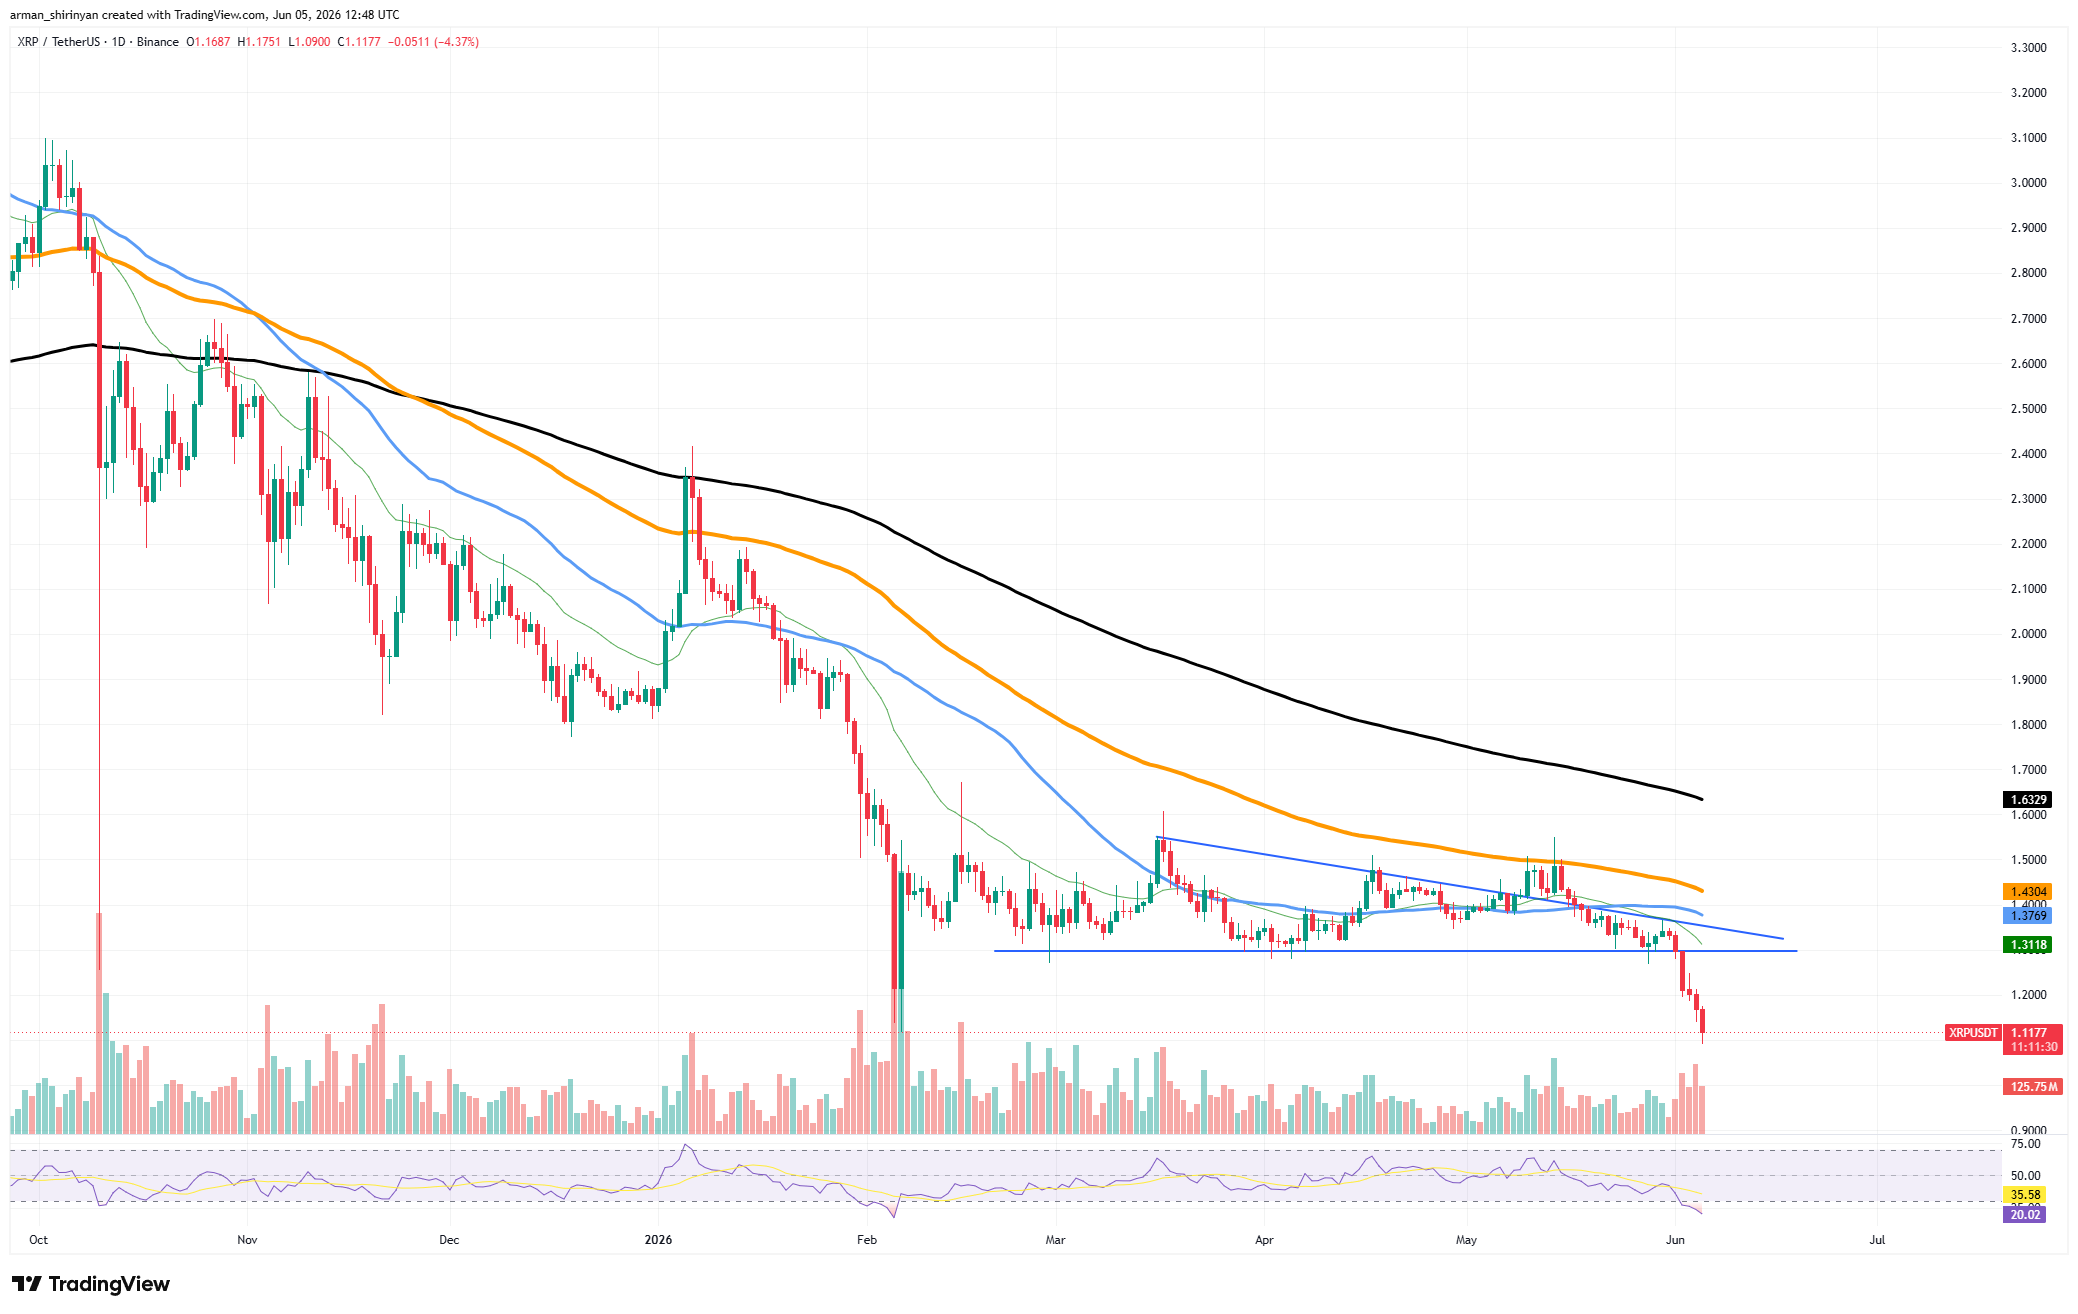 $XRP/USDT Chart by TradingView
In the past, abrupt increases in $XRP payment volume have not always resulted in an immediate increase in price. Large transfers may be the result of internal wallet reorganizations, exchange-related movements, or institutional settlements rather than direct purchase demand. In fact, despite the spike in activity, $XRP's price has continued to decline, indicating that transaction growth alone is currently insufficient to counteract broader market weakness.
For bulls, the chart presents a challenging picture. Recently, $XRP broke beneath a formation that had been developing for months, a descending triangle. Rising volume coincided with the breakdown, which is a classic indication that sellers are still in complete control. Additionally, the asset is trading below all of the major moving averages, and the RSI has declined into oversold territory.
Is it the sign of a sell-off?
The payment volume metric alone does not indicate whether coins are being purchased or sold. All that is measured is the quantity of $XRP flowing through the network. However, traders are more likely to interpret activity cautiously when abnormally high transaction volumes emerge during a steep decline, particularly if some of those transfers ultimately end up on exchanges.
As of right now, the data indicates increased network activity but does not provide conclusive proof of mass distribution. The next thing investors should keep an eye on is whether the payment volume stays high while the price stabilizes.
The current spike may ultimately be seen as an indication of underlying $XRP Ledger strength rather than the start of a larger capitulation event if network usage remains high and selling pressure starts to lessen.


