
Ethereum Golden Triangle Survives As Structure Remains Unbroken, This Target Says $10,000 Is Coming

By:Newsbtc
Bitget offers one-stop trading for cryptocurrencies, stocks, and gold. Trade now!
A welcome pack worth 6200 USDT for new users! Sign up now!
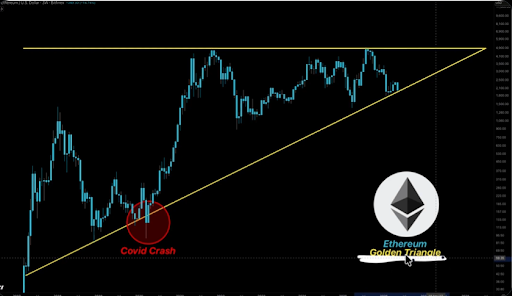
Technical analysis of the 3-week chart outlook shows ETH pressing into the apex of a golden triangle formation that has survived the Covid crash, the 2022 bear market, and the ongoing 2026 correction. According to the analyst who first identified it, what happens next at the apex of that structure may define Ethereum’s trajectory for the next several years.
Ethereum’s Nine-Year Structure
Ethereum’s 3-week candlestick chart highlights a long ascending support line beginning near the early market cycle lows and stretching through the 2020 Covid crash, the 2022 bear market, and the latest correction since its August 2025 all-time high of $4,946.

The formation’s upper boundary is a horizontal trendline, around the $4,800 to $4,900 range. Ethereum has struggled around that horizontal resistance, including during the 2021 peak and again during its return to record peaks. The lower boundary, however, has been the more important part of the structure because it has defined the larger bull-market trend for almost a decade.
var rnd = window.rnd || Math.floor(Math.random()*10e6); var pid607465 = window.pid607465 || rnd; var plc607465 = window.plc607465 || 0; var abkw = window.abkw || ''; var absrc = 'https://servedbyadbutler.com/adserve/;ID=172179;size=0x0;setID=607465;type=js;sw='+screen.width+';sh='+screen.height+';spr='+window.devicePixelRatio+';kw='+abkw+';pid='+pid607465+';place='+(plc607465++)+';rnd='+rnd+';click=CLICK_MACRO_PLACEHOLDER'; document.write('
');
if (!window.AdButler){(function(){var s = document.createElement("script"); s.async = true; s.type = "text/javascript";s.src = "https://servedbyadbutler.com/app.js";var n = document.getElementsByTagName("script")[0]; n.parentNode.insertBefore(s, n);}());}
var AdButler = AdButler || {}; AdButler.ads = AdButler.ads || []; var abkw = window.abkw || ""; var plc366606 = window.plc366606 || 0; (function(){ var divs = document.querySelectorAll(".plc366606:not([id])"); var div = divs[divs.length-1]; div.id = "placement_366606_"+plc366606; AdButler.ads.push({handler: function(opt){ AdButler.register(172179, 366606, [728,90], "placement_366606_"+opt.place, opt); }, opt: { place: plc366606++, keywords: abkw, domain: "servedbyadbutler.com", click:"CLICK_MACRO_PLACEHOLDER" }}); })();
Each major downturn has tested the trend, but the structure has not yet broken with a close below the support trendline with a 3-week candlestick. That is why the current position on the chart is more than another routine support test. According to a crypto analyst that goes by the name Crypto Tice on X, this is the moment of truth. The triangle has survived everything the market threw at it, but nothing it has faced compares to right now.
 Source:
Chart from Crypto Tice on X
Source:
Chart from Crypto Tice on X
Where Ethereum Goes From The Golden Triangle
The Golden Triangle now leaves Ethereum with two scenarios. The first is the bullish path, which depends on ETH continuing to hold the long-term ascending support line. The important breakdown level is at $1,950, meaning Ethereum still has to close the current 3-week candlestick above this level to keep the nine-year structure alive.

The Mistake Investors Are Making About Ethereum That Could Cost Them Money; Analyst
A successful hold above $1,950 would keep Ethereum inside the triangle and give bulls a chance to push the price back into the upper range of the structure. From there, the next important price level to watch is $4,350. That would turn the defensive setup into a breakout structure, with analyst Crypto Tice’s projected target at $10,000.
var rnd = window.rnd || Math.floor(Math.random()*10e6); var pid607472 = window.pid607472 || rnd; var plc607472 = window.plc607472 || 0; var abkw = window.abkw || ''; var absrc = 'https://servedbyadbutler.com/adserve/;ID=172179;size=0x0;setID=607472;type=js;sw='+screen.width+';sh='+screen.height+';spr='+window.devicePixelRatio+';kw='+abkw+';pid='+pid607472+';place='+(plc607472++)+';rnd='+rnd+';click=CLICK_MACRO_PLACEHOLDER'; document.write('
');
if (!window.AdButler){(function(){var s = document.createElement("script"); s.async = true; s.type = "text/javascript";s.src = "https://servedbyadbutler.com/app.js";var n = document.getElementsByTagName("script")[0]; n.parentNode.insertBefore(s, n);}());}
var AdButler = AdButler || {}; AdButler.ads = AdButler.ads || []; var abkw = window.abkw || ""; var plc452518 = window.plc452518 || 0; (function(){ var divs = document.querySelectorAll(".plc452518:not([id])"); var div = divs[divs.length-1]; div.id = "placement_452518_"+plc452518; AdButler.ads.push({handler: function(opt){ AdButler.register(172179, 452518, [728,90], "placement_452518_"+opt.place, opt); }, opt: { place: plc452518++, keywords: abkw, domain: "servedbyadbutler.com", click:"CLICK_MACRO_PLACEHOLDER" }}); })();
The second scenario is the bearish one. A break and multiple candlestick closes below $1,950 would carry far more weight than a normal pullback because it would push Ethereum beneath the rising support that has guided the market through the Covid crash and the 2022 bear market. Such a move would cancel out the golden triangle thesis and imply that the nine-year bullish structure has finally failed.
At the time of writing, Ethereum is trading at $1,575, down by 6% and 22% in the past 24 hours and seven days, respectively. However, there’s still time for Ethereum to return above $1,950 before the end of June.
ETH trading at $1,575 on the 1D chart | Source:
Tradingview.com
Featured image from iStock, chart from Tradingview.com
var rnd = window.rnd || Math.floor(Math.random()*10e6); var pid607473 = window.pid607473 || rnd; var plc607473 = window.plc607473 || 0; var abkw = window.abkw || ''; var absrc = 'https://servedbyadbutler.com/adserve/;ID=172179;size=0x0;setID=607473;type=js;sw='+screen.width+';sh='+screen.height+';spr='+window.devicePixelRatio+';kw='+abkw+';pid='+pid607473+';place='+(plc607473++)+';rnd='+rnd+';click=CLICK_MACRO_PLACEHOLDER'; document.write('
');
if (!window.AdButler){(function(){var s = document.createElement("script"); s.async = true; s.type = "text/javascript";s.src = 'https://servedbyadbutler.com/app.js';var n = document.getElementsByTagName("script")[0]; n.parentNode.insertBefore(s, n);}());}
var AdButler = AdButler || {}; AdButler.ads = AdButler.ads || []; var abkw = window.abkw || ''; var plc452519 = window.plc452519 || 0; (function(){ var divs = document.querySelectorAll(".plc452519:not([id])"); var div = divs[divs.length-1]; div.id = "placement_452519_"+plc452519; AdButler.ads.push({handler: function(opt){ AdButler.register(172179, 452519, [728,90], 'placement_452519_'+opt.place, opt); }, opt: { place: plc452519++, keywords: abkw, domain: 'servedbyadbutler.com', click:'CLICK_MACRO_PLACEHOLDER' }}); })();
0
0
Disclaimer: The content of this article solely reflects the author's opinion and does not represent the platform in any capacity. This article is not intended to serve as a reference for making investment decisions.
Understand the market, then trade.
Bitget offers one-stop trading for cryptocurrencies, stocks, and gold.
Trade now!
You may also like
Is the AI server a feast or just a valuation bubble? Evercore ISI downgrades HPE.US to "market perform," share price plummets over 10%.
Evercore ISI downgraded Hewlett Packard Enterprise (HPE.US) from "Outperform" to "In-line," citing that following a significant increase in stock price, the risk-reward ratio has become more balanced.
智通财经•2026/09/15 02:31

UK weighs tokenized gold reforms – Here’s why the timing matters for crypto
AMBCrypto•2026/09/15 01:03
As Anthropic proposes the "AI slowdown theory," AI commercialization is accelerating! From model development to financial advisory, the benefits of AI agents are being realized at a faster pace.
Anthropic is simultaneously advancing frontier AI risk governance and the commercialization of enterprise AI applications, competing with leading AI application rivals such as OpenAI for AI monetization.
智通财经•2026/09/15 01:01

Crypto prices
More
Bitcoin
BTC
$77,858.23
+0.43%

Ethereum
ETH
$2,511.39
+0.18%

Tether USDt
USDT
$0.9998
+0.03%

BNB
BNB
$720.18
-0.30%

XRP
XRP
$1.43
+4.82%

USDC
USDC
$0.9999
+0.01%

Solana
SOL
$102.1
+1.37%

TRON
TRX
$0.3377
-0.29%

Hyperliquid
HYPE
$80.2
+1.30%

Zcash
ZEC
$1,156.9
+4.87%
How to buy BTC
Bitget lists BTC – Buy or sell BTC quickly on Bitget!
Trade now
Become a trader now?A welcome pack worth 6200 USDT for new users!
Sign up now