The “most realistic” $XRP chart points to a possible rally to $10, according to well-known analyst Celal Küçüker, who has shared the timeline for this target.
Küçüker’s analysis comes at a time when sentiment surrounding $XRP has declined to new lows amid the latest market-wide pullback. With this decline, $XRP’s year-to-date loss has grown to 38%.
Despite the decline, the analyst suggests $XRP could reach $10 between December 2026 and February 2027, calling this chart “most realistic.”
$XRP’s Rising Channel
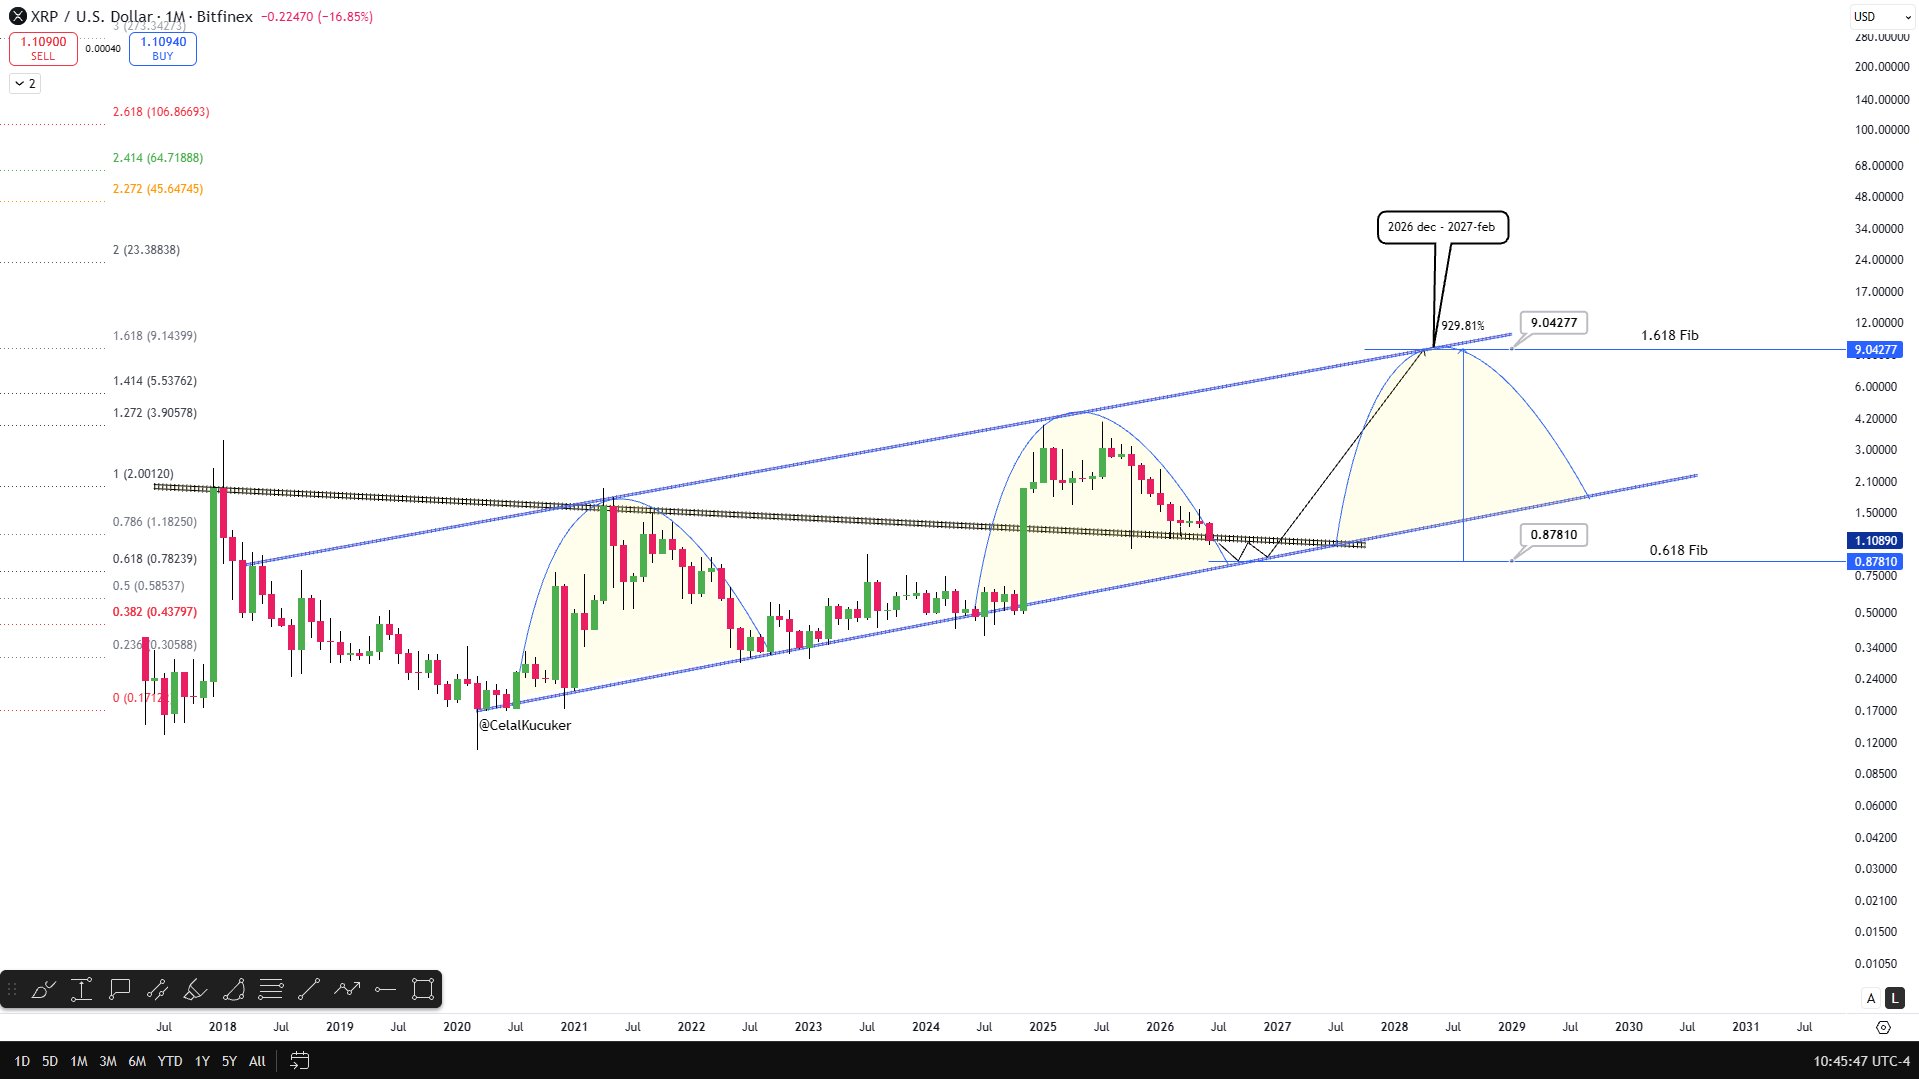
Küçüker’s chart shows that $XRP has maintained its position within a rising channel that has dictated its price action for more than six years now.
For context, this channel started forming on the monthly chart after $XRP fell to $0.11 in March 2020 and then staged a recovery effort.
 $XRP Rising Channel | Celal Kucuker
The channel’s support trendline emerged at this point and has remained relevant to this day, as $XRP has continued to find support at the line. Notably, this support trendline trends upward, indicating that since March 2020, $XRP has continued to see higher lows.
Meanwhile, overhead, $XRP faces a resistance line that has capped its upside potential. The first time $XRP tested this trendline was when it ran to $1.96 in April 2021. The resistance at this line led to a pullback.
$XRP retested the trendline at $3.4 in January 2025 and $3.6 in July 2025, facing a roadblock each time. Also, the upper resistance trendline has continued to trend upward, showing that $XRP has seen higher highs since April 2021. This has resulted in the formation of the rising channel.
Historical Pattern
Interestingly, Küçüker’s chart shows a historical pattern surrounding the rising channel that persistently leads to an upward trend for $XRP.
Specifically, whenever $XRP’s price drops to find support at the lower trendline, what follows is a recovery and then a price spike to higher highs until it finds resistance at the upper trendline. This pattern resulted in the rally to $1.96 in April 2021, $3.4 in January 2025, and $3.6 in July 2025.
Timeline for $XRP to $10
With $XRP now eyeing a retest of the lower trendline again amid the ongoing downtrend, Küçüker believes the pattern could play out again.
First, he expects $XRP to decline further toward $0.87, which aligns with the 0.618 Fibonacci retracement and the lower support trendline. Notably, analysts like Chart Nerd and Casi also believe a potential drop toward similar levels may play out.
Once bulls find strength here, they could engineer a rebound campaign that would help $XRP recover the losses of the last few months and eventually aim for higher prices.
The market analyst sees $XRP soaring to a higher high of around $10 during this rally, similar to the historical pattern that has played out for six years. He believes this is the “most realistic” $XRP chart in the market today and suggests that the rally to $10 could happen between December 2026 and February 2027.