Prominent market analyst EGRAG has shared how what he calls the $XRP “face-melting setup” could lead prices to double digits.
Amid the broader crypto market collapse, $XRP has recorded a 14.8% drop this month alone. As prices fell, data confirms that the asset has now lost the 50-period Exponential Moving Average (EMA) on the monthly chart.
Despite the weakness, $XRP remains above the 100-period EMA. EGRAG pointed out this setup in a recent analysis and explained what it could mean for the next move, presenting a path to $27.
$XRP’s Historical Pattern Suggests Move Toward 100 EMA
EGRAG based his analysis on how $XRP has behaved in the past around the 50 EMA and 100 EMA on higher timeframes. He noted that when $XRP clearly loses the 50 EMA on the monthly chart, the price usually moves toward the 100 EMA sooner or later.
In previous cycles, this move followed a similar path. The price first showed a loss of momentum, then broke below the 50 EMA. This often led to panic selling, followed by a final sweep of liquidity around the 100 EMA. After this phase, $XRP typically entered a new macro expansion phase.
According to EGRAG, the same structure may be forming again. $XRP lost the 50 EMA when it dropped below $1.3, with the indicator currently sitting at $1.32, while the asset trades around $1.13. This supports the idea that $XRP could continue following its past pattern.
$XRP Downside Targets $0.93 and the “Death Zone”
Data from the accompanying chart also reveals a projected path lower, which EGRAG calls the green trajectory. This path suggests that $XRP may keep falling as the market looks for a true macro bottom.
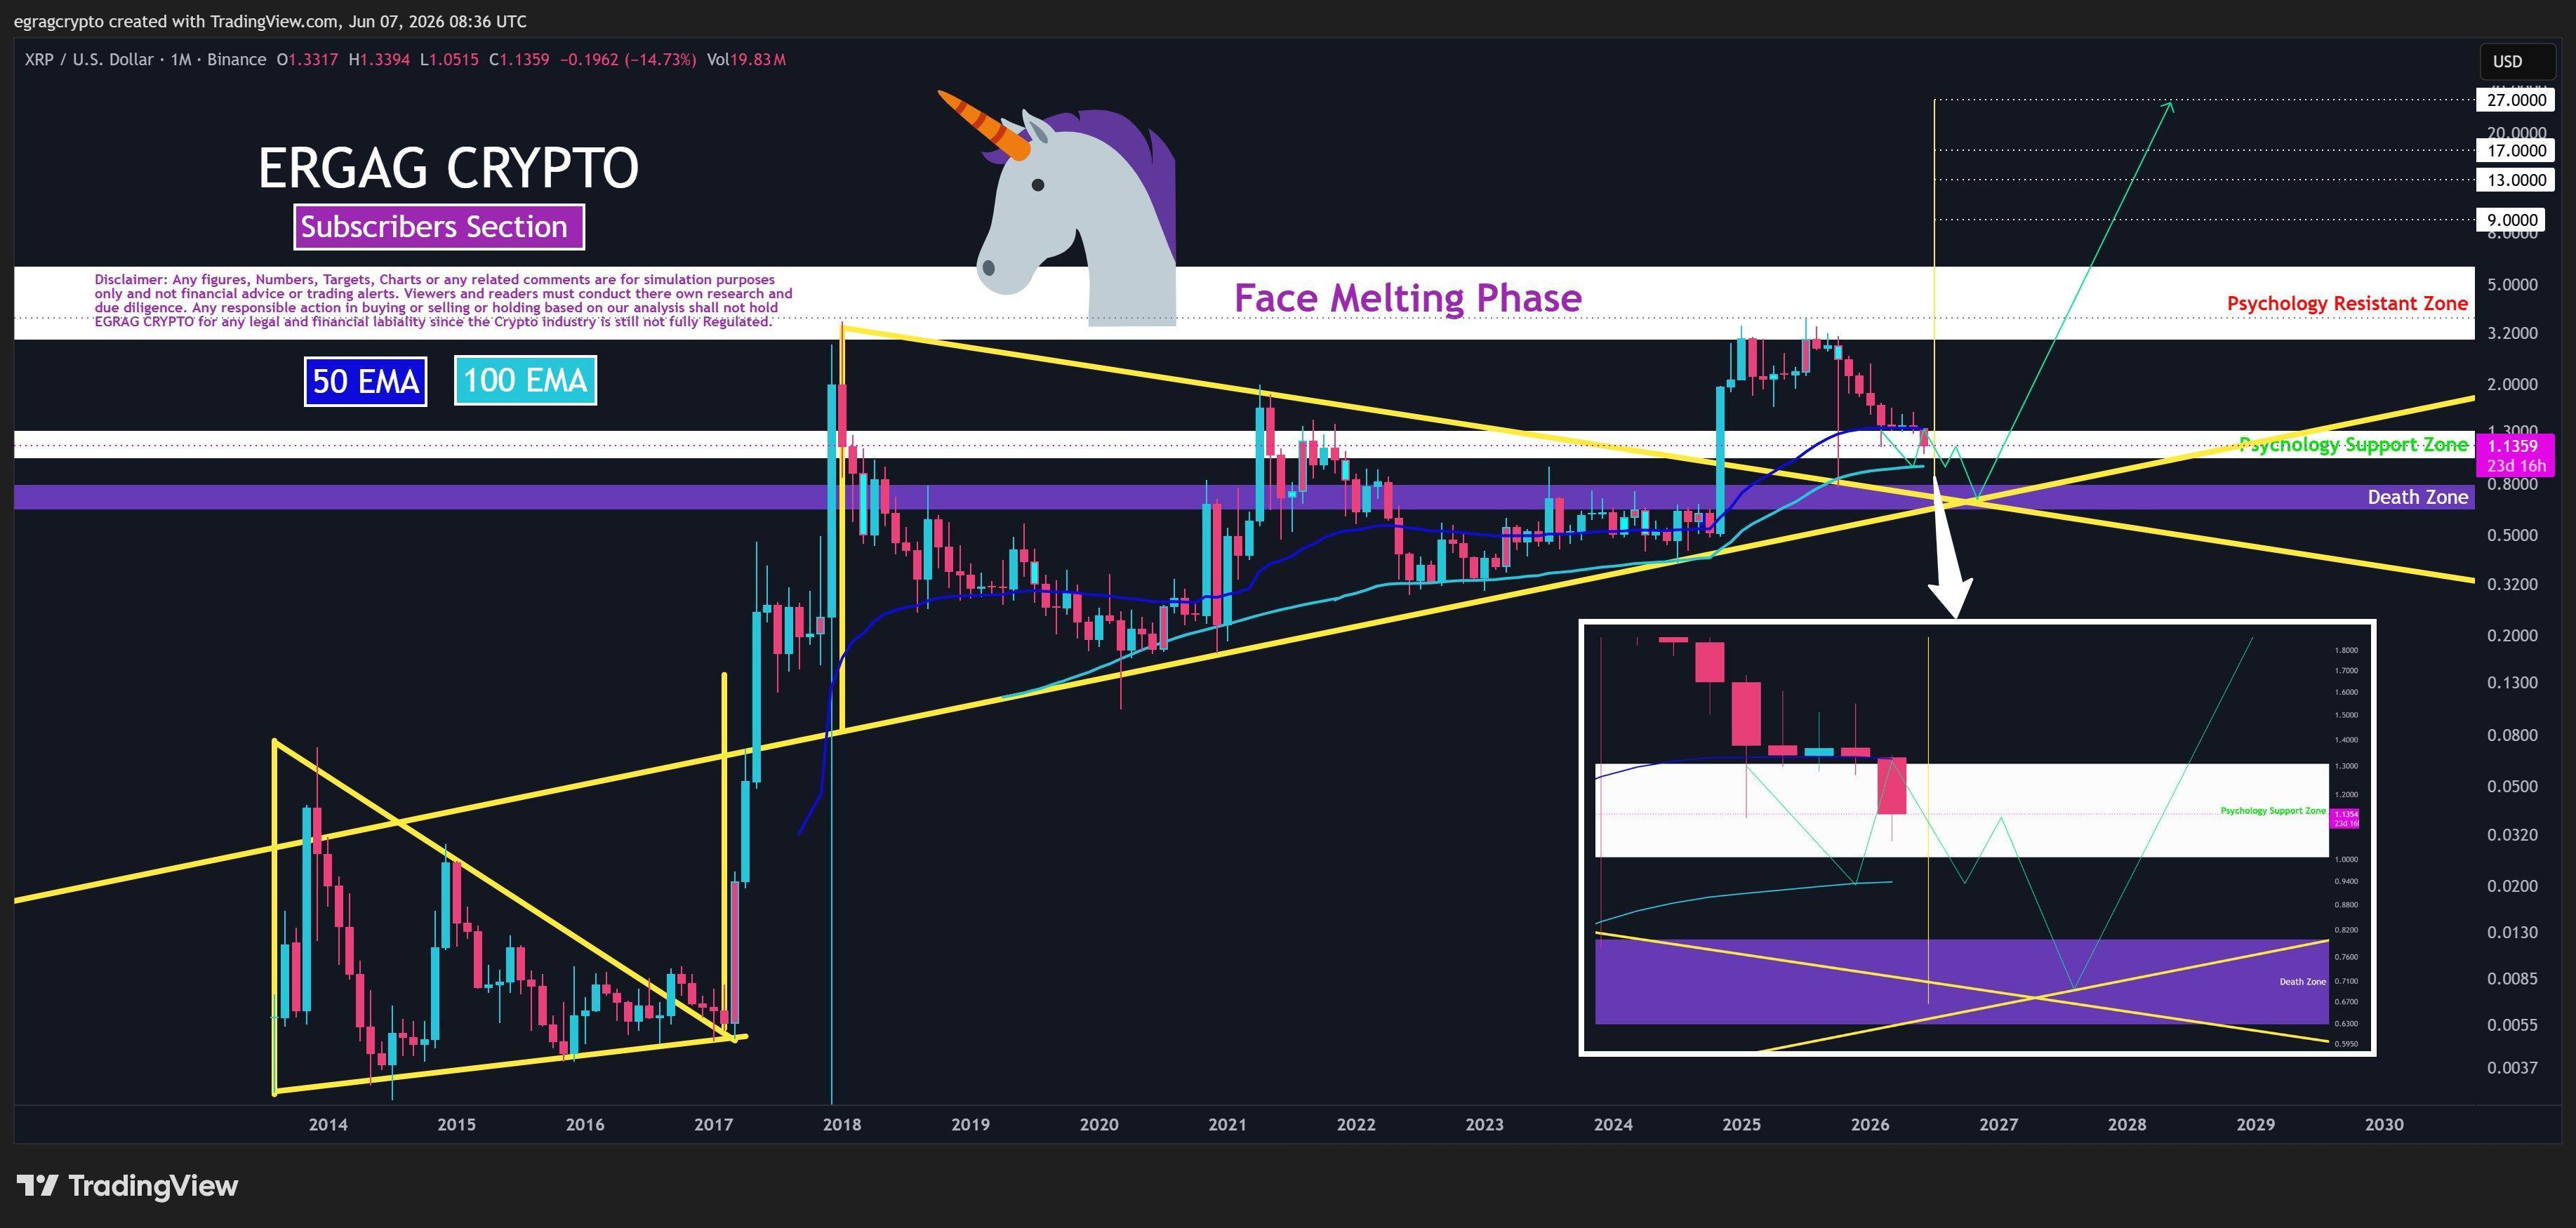 $XRP 1M Chart | EGRAG Crypto
If the green trajectory plays out, $XRP could retest the 100 EMA at $0.93, where it may find some support at first. However, even if the price bounces there, EGRAG expects that $XRP could drop again below the 100 EMA. If this happens, the price may move into what he calls the “death zone,” which lies between $0.70 and $0.80.
This range could mark the final stage of the decline, where selling pressure reaches its peak before the market stabilizes. The analyst sees this as a major part of the cycle before a stronger recovery begins.
$XRP Eyes $9, $13, $17, and $27
Despite the short-term weakness, EGRAG remains confident about $XRP’s long-term potential. He believes that after falling into the $0.70 to $0.80 death zone, $XRP could find support and begin a massive upward move.
From there, the price could push toward new highs, with targets at $9, $13, $17, and eventually $27. EGRAG chose to call this phase the “face-melting” setup due to the scale of the expected upsurge.
Meanwhile, he also revealed why he continues to accumulate $XRP even if prices may fall further. He explained that risk management is more important than trying to buy at the exact bottom.
Specifically, whether someone buys at $1.09, $0.92, $0.85, or even $0.70, it makes little difference if $XRP later reaches $7, $8, $13, or higher double-digit levels.