

 invezz.com
The bearish performance is being fueled by weaker Bitcoin sentiment and fading risk appetite across digital assets.
Growing uncertainty in both institutional and retail participation is adding to downside pressure, raising concerns about a potential deeper correction below the $60 zone.
Institutional activity remains mixed despite ETF inflows
Institutional sentiment toward Solana remains uneven, with ETF flows showing growing participation.
Data indicates $SOL-focused exchange-traded funds recorded $754,740 in inflows on Tuesday, following over $471,000 in outflows on Monday.
However, this short-term inflow is overshadowed by broader weakness, including a $6.52 million net weekly outflow last week, suggesting that institutional conviction remains fragile.
While institutional demand remains mixed, retail participation continues to decline.
Solana’s derivatives data point to a declining engagement in recent days.
Data obtained from CoinGlass reveals that Solana’s futures Open Interest (OI) is down by 3.7% in the last 24 hours and now reads $4.44 billion.
This indicates that retail traders are reducing their leveraged positions in the market.
Furthermore, the funding rates have declined, indicating reduced bearish aggression but still reflecting cautious sentiment.
Solana price analysis: Will $SOL drop below $60?
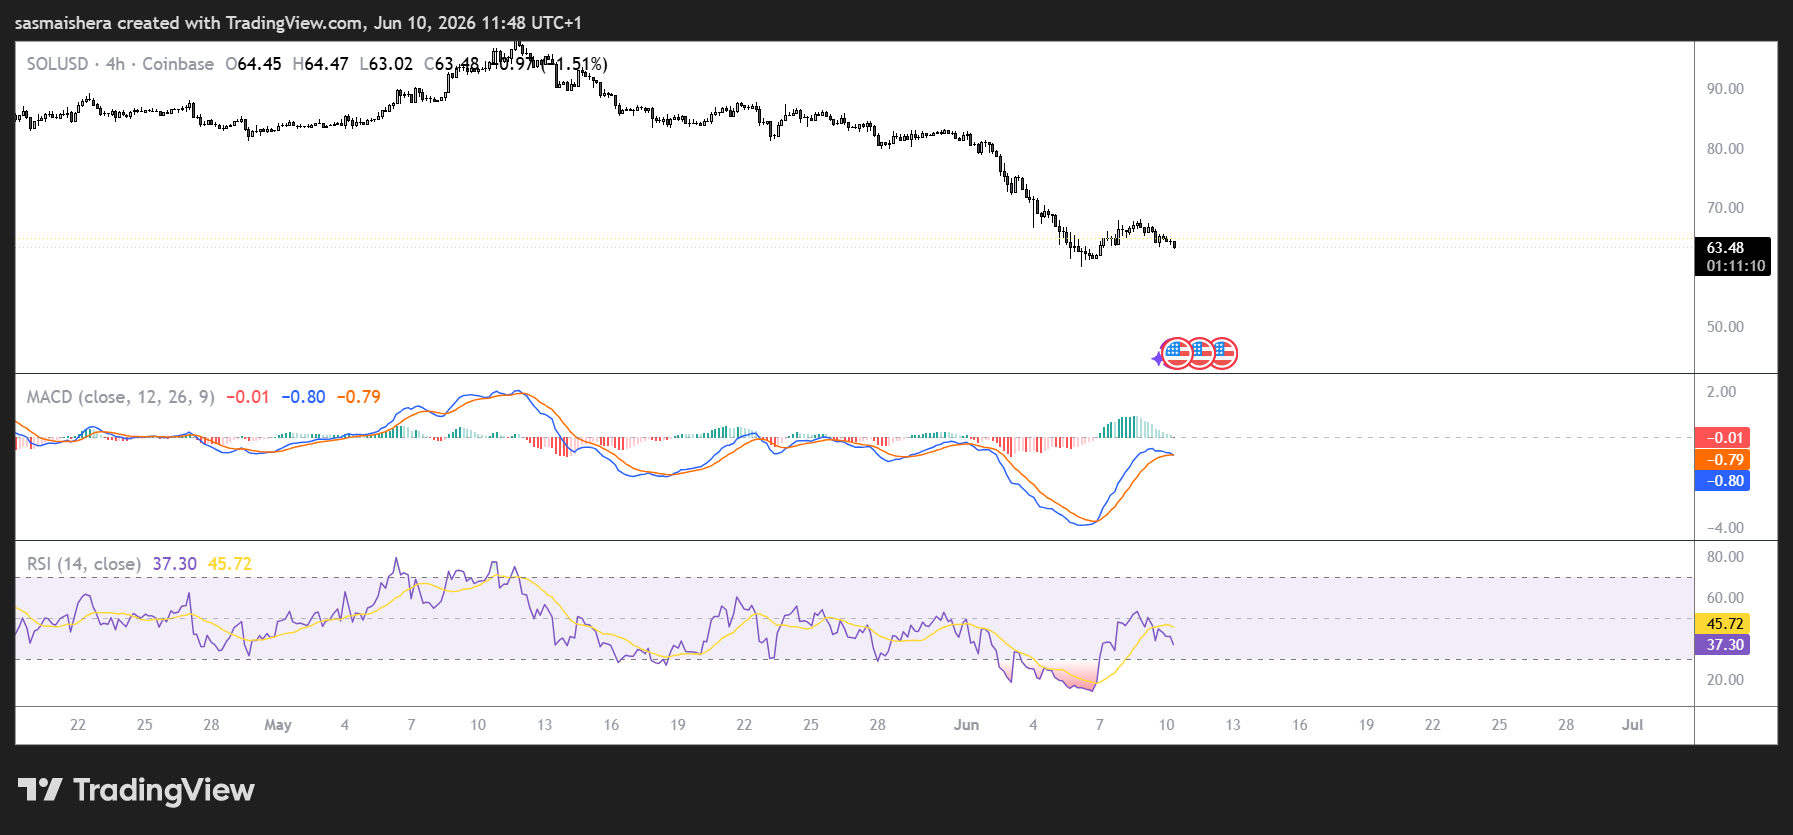
Similar to the other leading cryptocurrencies, the $SOL/USD 4-hour chart is extremely bearish following the recent market selloff.
At press time, $SOL is trading at $63.44, below key moving averages, ensuring that the bearish structure remains in place.
The recent bounce from the $60.13 low now appears fragile, with immediate downside risk toward the $59.11 support level (December 2023 low).
If the bulls fail to defend the $59.11 support level in the near term, $SOL could extend its bearish downtrend towards the next major support at $51.28, with the psychological $50 level acting as a key threshold.
A breakdown below $59 could accelerate losses and deepen the bearish trend.
Momentum indicators suggest that selling pressure remains dominant but may be nearing exhaustion.
The MACD remains deep in the negative territory but is showing early signs of narrowing the bearish momentum.
The RSI of 45 is approaching the neutral territory, indicating a fading bearish pressure but not a confirmed reversal
These signals suggest that while downside momentum may slow, trend reversal conditions are not yet in place.
If the bulls regain control, $SOL would encounter immediate resistance at the $67.50 level, with another hurdle at $75.63.
A decisive candle close above these levels would allow $SOL to target the 50-day and 100-day EMAs at $80.25 and $87.25, respectively.
A rally above $67.50 would be the first sign of stabilization, while reclaiming $80+ would be required to shift momentum meaningfully.
Solana remains under sustained bearish pressure, with weak institutional inflows and declining derivatives activity reinforcing the downside bias.
While oversold technical conditions may trigger short-term bounces, a broader recovery likely requires stronger demand and a reclaim of key moving averages.


