
Finding a Floor

Executive Summary
- The AVIV z-score reached -1.09 before settling at -1.06, placing the market deep within the extreme discount band relative to the cyclical mean, with price failing to bounce meaningfully from the low, confirming persistent fear in sentiment.
- More than 95% of the short-term holder cohort is underwater, with the Percent of STH Supply in Profit recovering only marginally to 3.3% against a 4-year mean of 55%, leaving the market structurally fragile and vulnerable to external shocks.
- The STH-SOPR z-score printed -1.86 at its lowest, close to the severe capitulation threshold at -2, indicating loss realization is approaching but has not yet reached the intensity historically associated with durable relief bounces.
- US institutional demand has weakened materially, with the Coinbase Premium remaining in discount territory as BTC fell toward $60K, signalling a lack of aggressive spot buying from Coinbase-based investors.
- Corporate treasury accumulation has slowed sharply, with net inflows falling from peaks above $500M per day to near-zero levels since June, removing another source of market support.
- A major deleveraging event swept through the market, as BTC broke below key support levels and liquidated a large concentration of leveraged longs, flushing excess speculation from the system.
- Implied volatility has repriced sharply higher following Bitcoin’s breakdown, while the volatility risk premium remains elevated as options continue to price more uncertainty than recent realized moves alone would justify.
- Skew has surged across maturities, reflecting a significant increase in demand for downside protection as traders pay higher premiums for put exposure.
- Defensive flow continues to dominate activity, leaving the largest negative gamma cluster concentrated around 65K and close to current spot levels.
Macro Insight
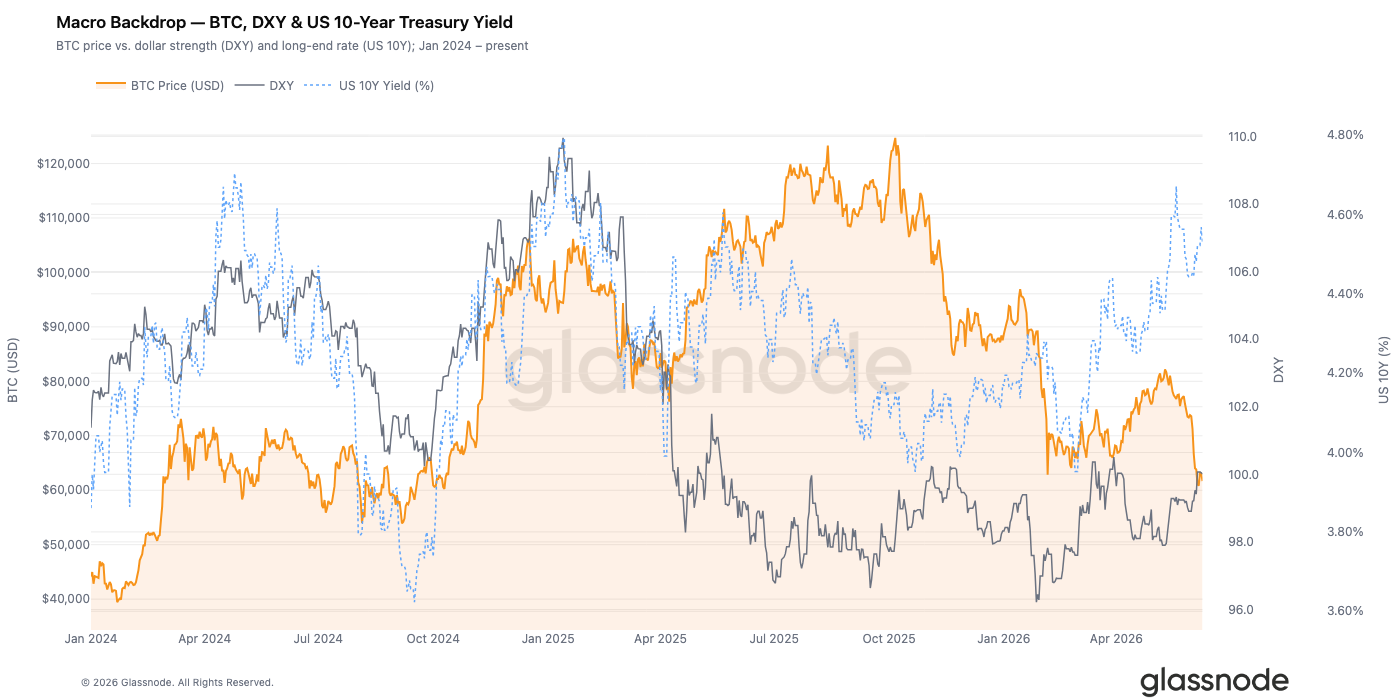
The DXY closed at 100.01, up 0.8% week-on-week and 2.1% over 30 days, extending a dollar bid that has kept global liquidity conditions tight for the better part of the past month. The US 10-Year Treasury Yield held at 4.53% while the 2-Year settled at 4.14%, leaving the 10Y-2Y spread at +0.39%, a curve shape consistent with a late-cycle environment where the Fed has yet to shift its posture meaningfully.
Bitcoin absorbed the week's macro headwind with a 7.5% decline to $61,700. The inverse relationship between dollar strength and crypto risk that defined 2022-23 has reasserted itself after a period of decoupling. DXY above 100 alongside 10-Year yields above 4.5% describes a rate-and-dollar configuration that has historically compressed speculative risk premiums.
A durable recovery in Bitcoin will require either the DXY to break below 99 with conviction or the 10-Year to compress toward 4.2%. Neither condition is currently met.
On-chain Insight
Deepening the Discount
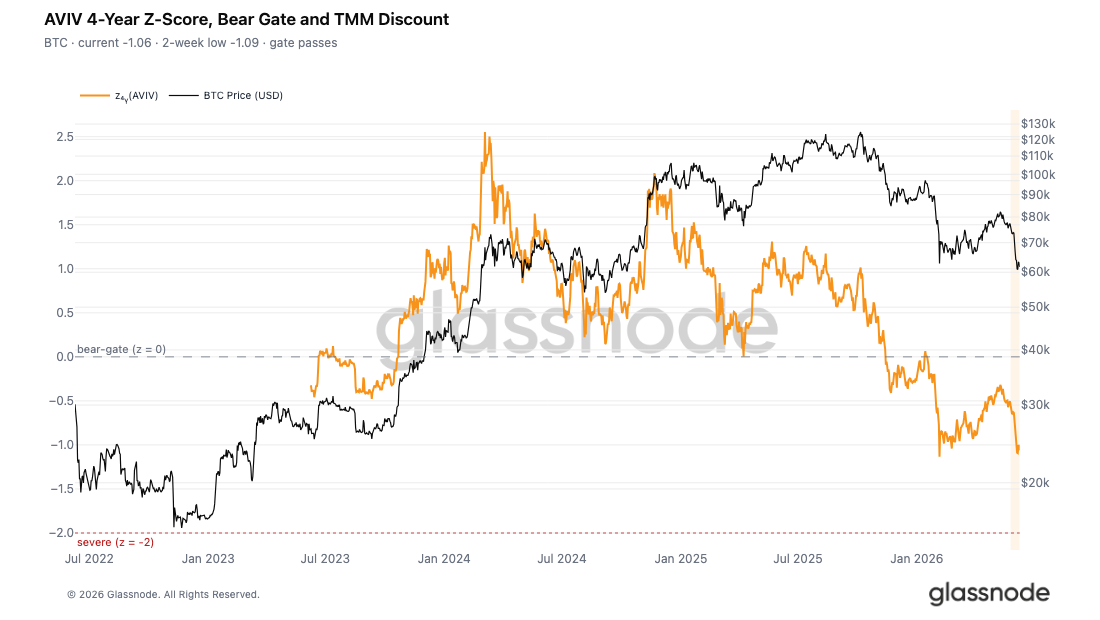
Last week's edition framed the May rally as a bear bounce, with the Short-Term Holder Cost Basis falling beneath the True Market Mean for the first time since January 2022, signaling later-stage bear conditions. This edition extends that read by examining the subsequent correction, including the leg down to $59k and the fragile sideways consolidation that has followed.
To gauge how deep this dip was relative to the cyclical mean, we turn to the AVIV Ratio, which compares spot price to the True Market Mean, or the active-investor cost basis excluding miners. Its 4-year z-score provides a cycle-comparable measure of deviation from that anchor, with zero marking the threshold between discount and premium territory. The current z-score reads -1.06 with AVIV at 0.80, while the lowest print over the past two weeks reached -1.09, placing the discount in the extreme low band of the historical distribution. The fact that price has not bounced meaningfully away from this cyclical low over the past week underscores the persistence of fear in current market sentiment.
Recent Buyers Underwater
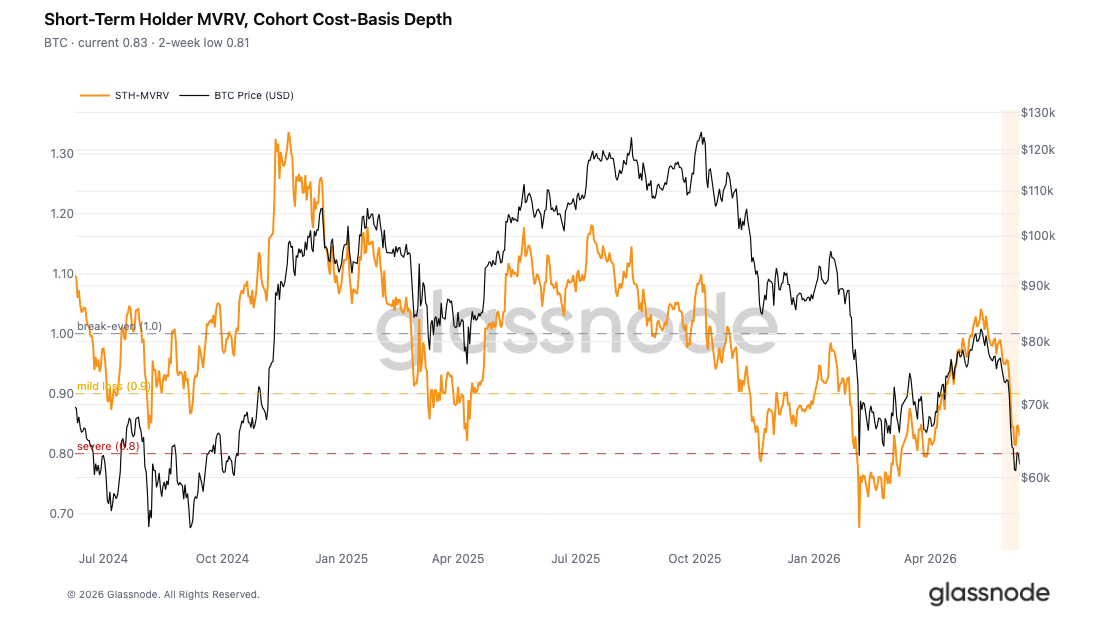
Following the same framework applied to the broader market discount, the contraction can also be examined through the lens of recent buyers specifically. The Short-Term Holder MVRV compares spot price to the Short-Term Holder Realized Price, with readings below 1 indicating that this cohort is sitting in aggregate unrealized loss. The recent low printed 0.81 before a modest rebound to 0.83, leaving new investors roughly 17% to 19% underwater on average. This confirms that the $78k to $82k accumulation cluster built during the May rally is now broadly in loss, consistent with last week's "new buyers under pressure" framing.
The short-lived stabilization observed since the low is a common post-selloff structure, typically emerging once the initial wave of forced selling from the most distressed holders subsides and remaining participants adopt a wait-and-see posture. Whether this pause evolves into a durable floor or merely a consolidation before a further leg down will depend on whether new demand materializes at current levels.
Nearly All Recent Buyers in Loss
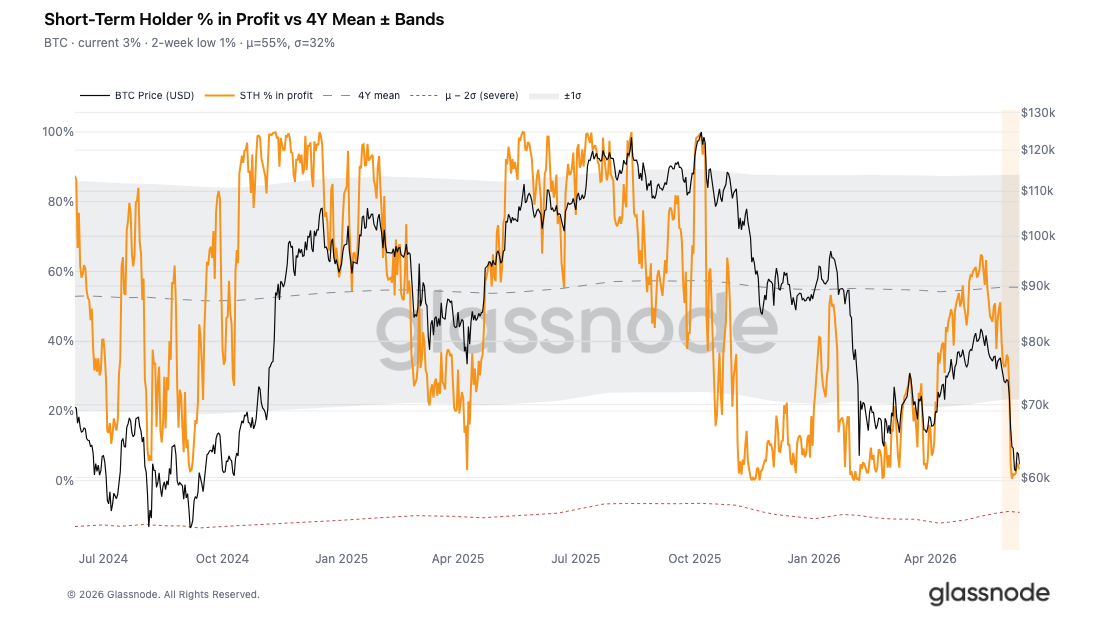
Completing the assessment of pressure on the recent buyer cohort, the Percent of Short-Term Holder Supply in Profit offers a complementary perspective by measuring dominance rather than depth of unrealized losses. This metric captures the ratio of short-term holder supply in profit to total short-term holder supply, gauging how broadly distributed profitability is across new market participants.
The recent low printed just 0.6% before recovering marginally to 3.3%, a reading that sits dramatically below the 4-year mean of 55%. In practical terms, more than 95% of the recent buyer cohort is currently underwater. Readings of this magnitude fall within the significant capitulation band historically, where broad-based stress among new investors leaves the market structurally fragile and highly vulnerable to any negative external catalyst. The combination of near-total loss dominance and the absence of meaningful recovery in this metric reinforces the assessment that current sideways price action represents an exhaustion pause rather than a stabilized floor.
Approaching Capitulation
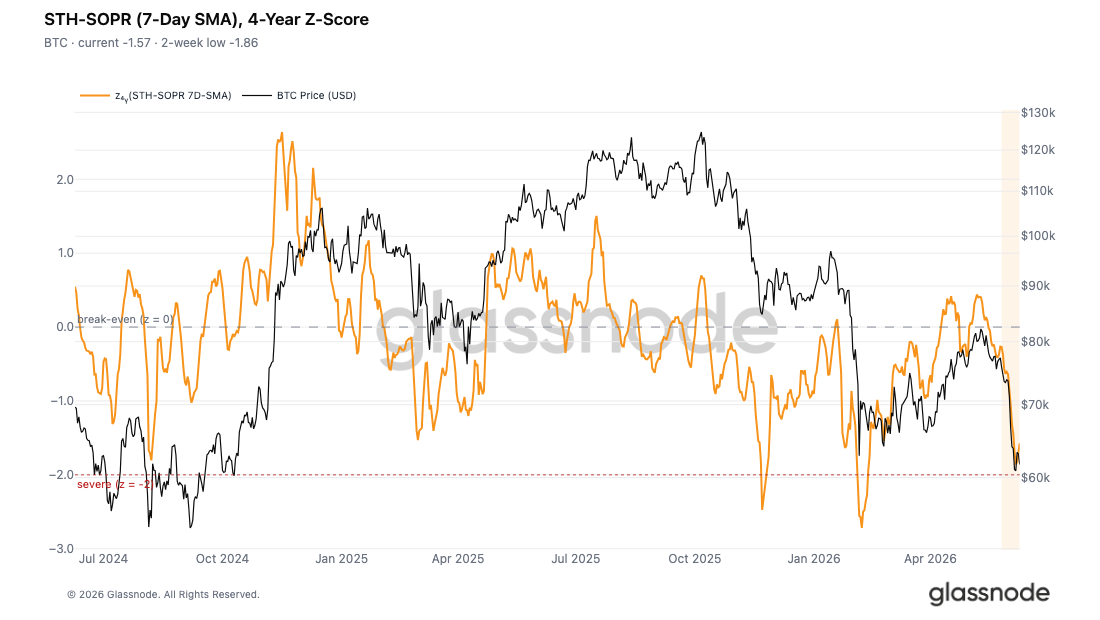
Beyond the unrealized loss landscape, realized spending behavior confirms the severity of the current regime. The STH-SOPR 7-day SMA, when measured against its 4-year mean on a z-score basis, captures how extreme recent-buyer loss realization is on a cycle-normalized scale. The current reading sits at -1.57, with the two-week low reaching -1.86, placing the recent extreme within just 0.14 standard deviations of the -2 threshold that has historically marked severe capitulation events.
Recent buyers are crystallizing losses at an elevated and accelerating pace, consistent with last week's $1.35B daily total realized loss observation and the STH-MVRV depth signal discussed above. However, the final capitulation intensity that has historically preceded the mid-term to long-term relief bounces has not yet fully emerged. The market sits in an uncomfortable interim where loss realization is severe enough to confirm deep-bear conditions, but not yet extreme enough to suggest that the selling exhaustion required for a durable floor has been reached.
Off-chain Insight
Coinbase Premium Dissappears
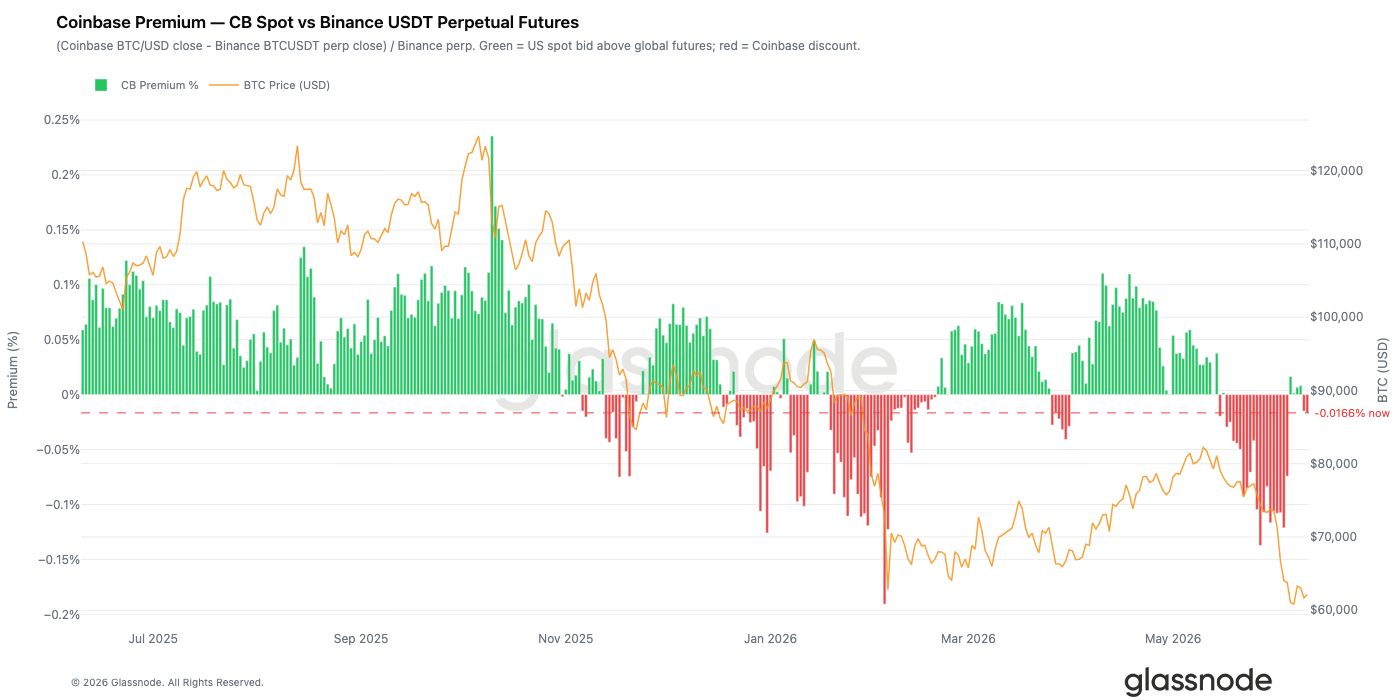
The Coinbase Premium, which tracks the gap between Coinbase spot prices and Binance perpetual futures prices, offers a useful window into US institutional demand. When Coinbase trades at a premium, it suggests institutions are actively buying spot BTC, pushing prices above those seen in offshore futures markets.
That dynamic has shifted in recent weeks. The premium has remained firmly in discount territory, indicating that US spot demand has faded as BTC sold off toward $60K. Unlike previous pullbacks that attracted strong dip-buying, the current correction has seen institutions remain largely on the sidelines, removing an important source of support for the market.
 Custom Chart
Treasury Demand Begins to Fade
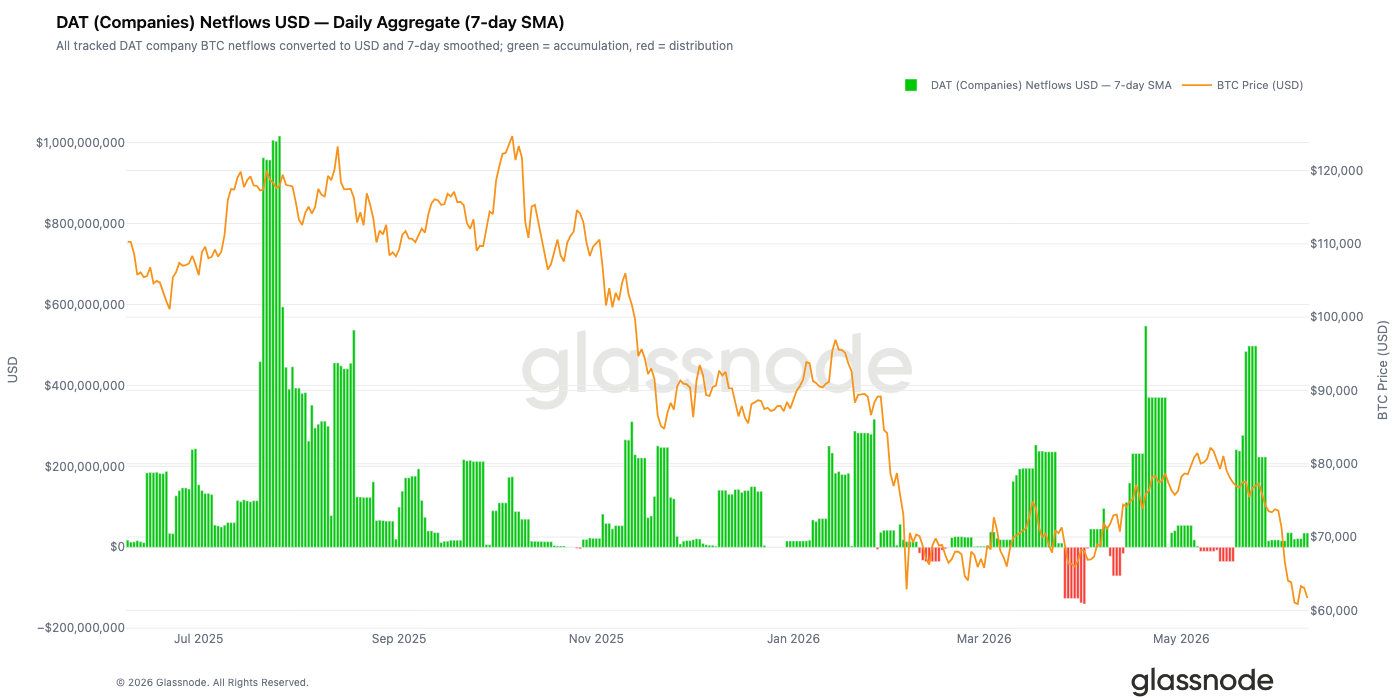
Corporate treasury buying was a major source of support through April and May, with several periods of accumulation exceeding $500M per day. However, that demand has softened considerably since the start of June.
As BTC broke down from the mid-$70Ks toward $60K, net inflows from corporate treasury firms fell sharply, with daily purchases slowing to a fraction of their recent pace. While companies remain net buyers overall, the decline in accumulation suggests this cohort is becoming more cautious, removing another source of marginal demand at a time when broader market sentiment remains weak.
Leverage Flush Beneath $70K
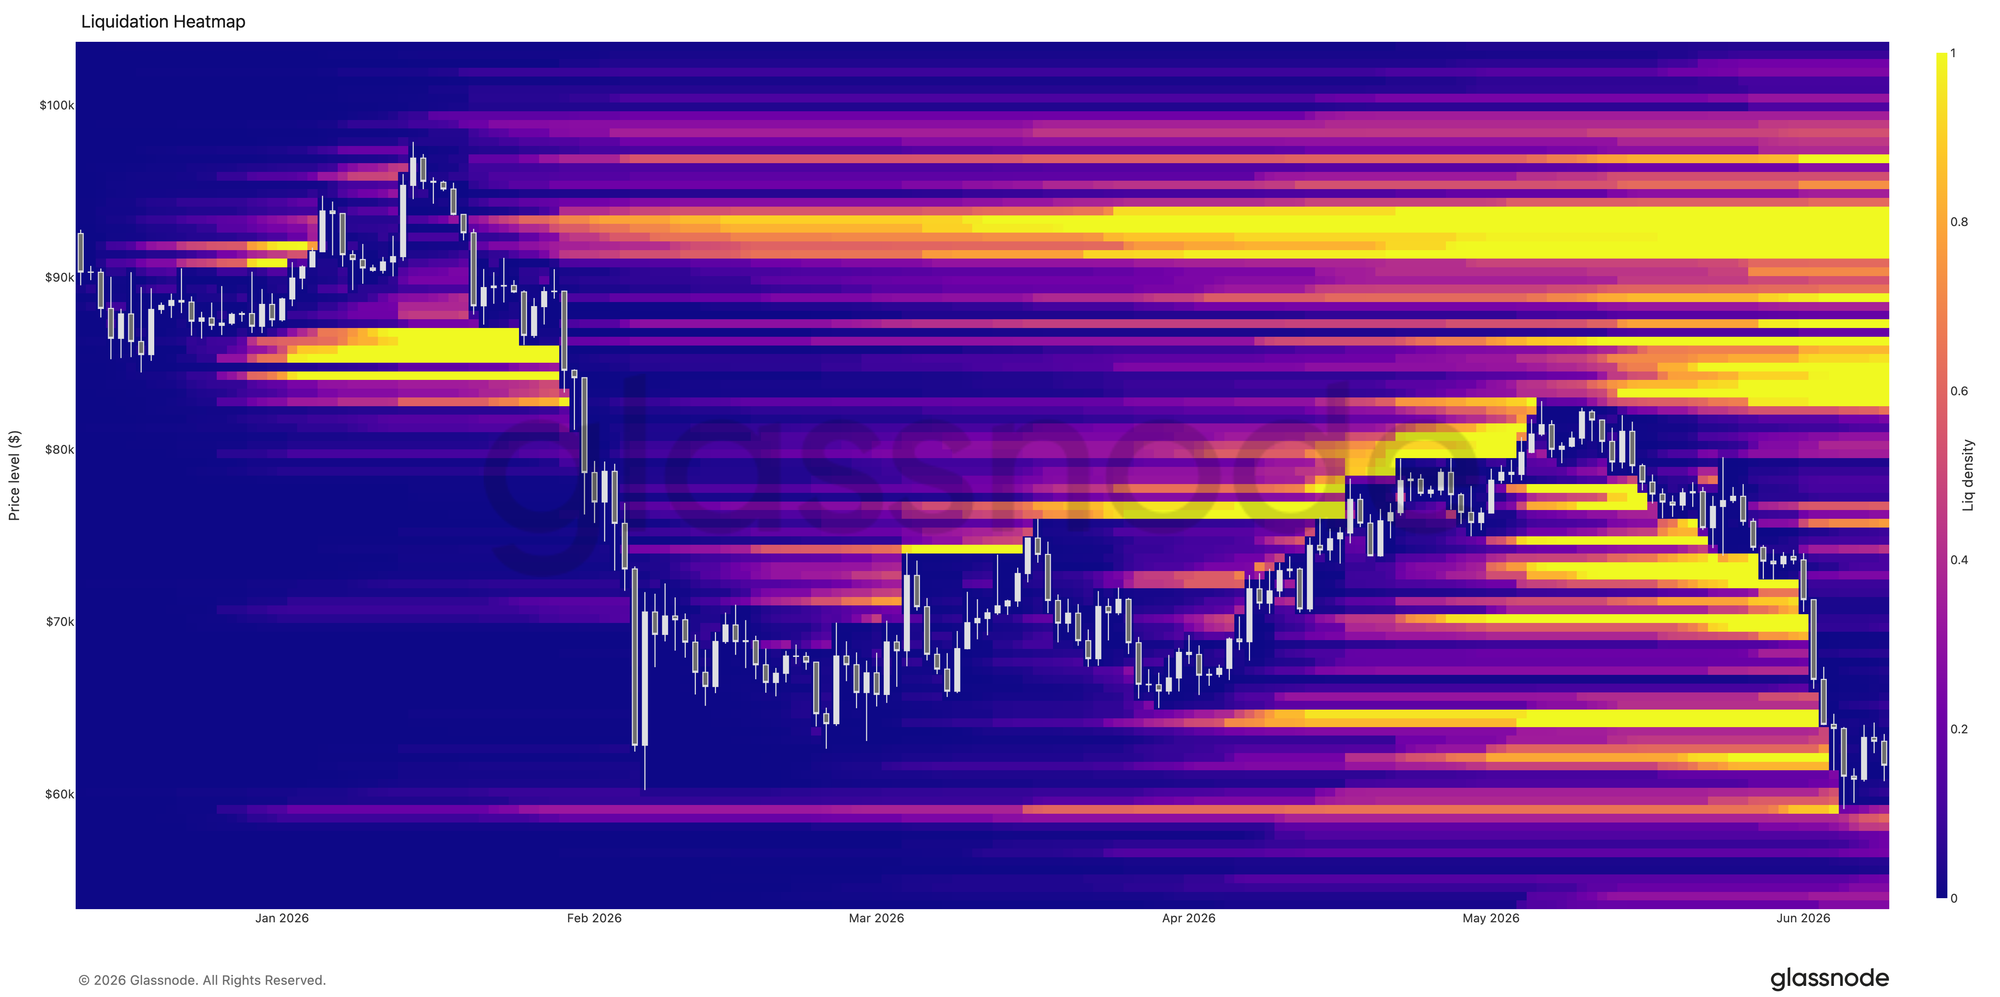
The liquidation heatmap shows a large concentration of leveraged long positions sitting between $64K and $70K, which were aggressively cleared as BTC broke lower over the past week. The sharp move through this zone triggered a cascade of liquidations, helping drive price briefly below $60K before finding support.
With much of the nearby long-side liquidity now exhausted, the market has undergone a significant deleveraging event. The liquidation profile is notably cleaner than it was a week ago, suggesting a large portion of the excess leverage that had built up during the recent range has now been flushed from the system.
Implied Volatility Reprices Higher Across the Curve
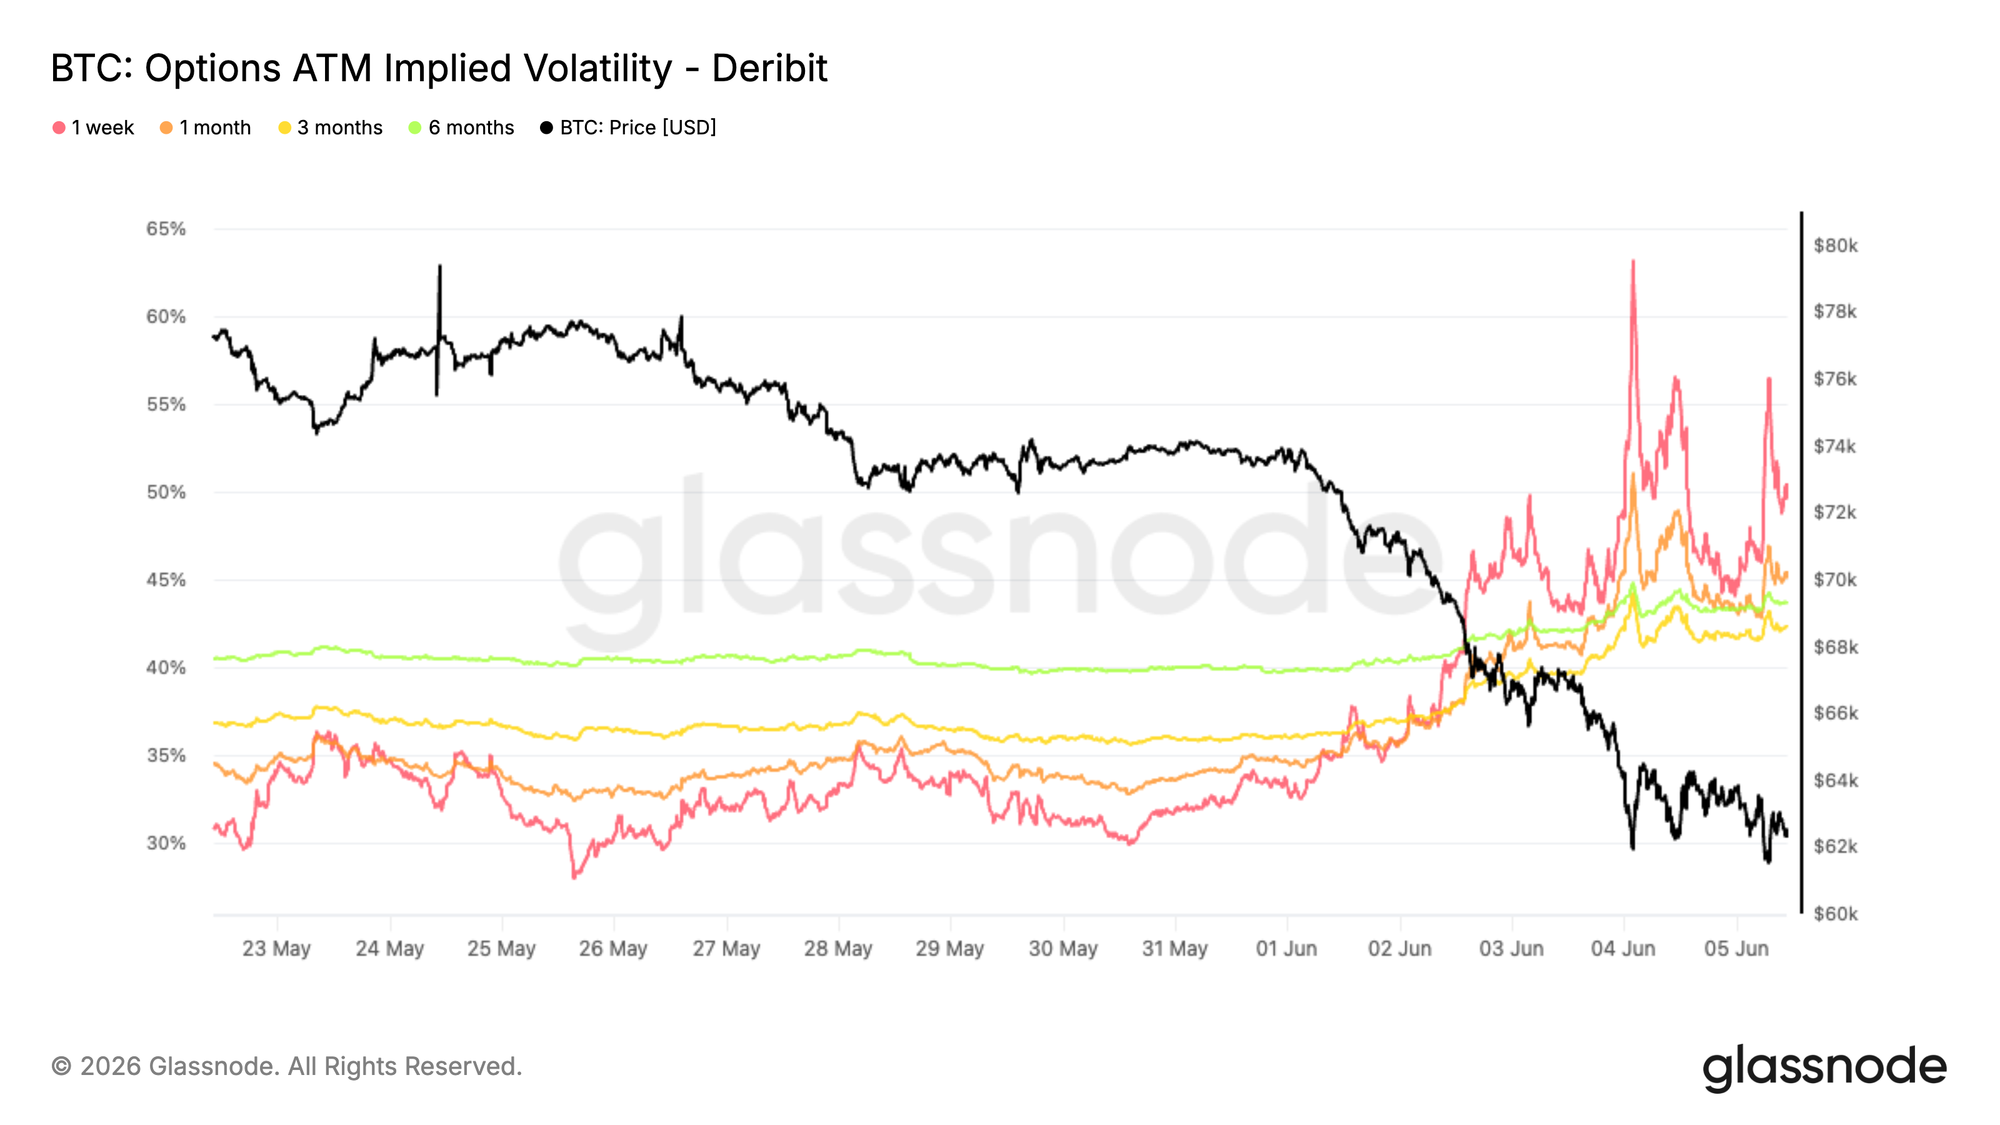
Starting with implied volatility, Bitcoin's break below its multi month range triggered a sharp repricing across the volatility surface. As spot fell toward the February lows, demand for optionality increased across maturities.
The front end saw the strongest reaction. One week at the money implied volatility briefly surged above 60% before settling near 50%, while the 1 month tenor climbed from roughly 34% to 45%. Longer dated maturities also moved higher, with the 6 month tenor rising from around 40% to 44%.
The move reflects a broad reassessment of market uncertainty rather than a short lived reaction. While volatility has eased from its peak, demand for optionality remains elevated, showing that traders are still willing to pay higher premiums for protection despite some stabilization in spot.
The recent selloff has led to a meaningful repricing of volatility expectations, with protection becoming more expensive across the curve as uncertainty remains elevated.
Volatility Risk Premium Remains Elevated
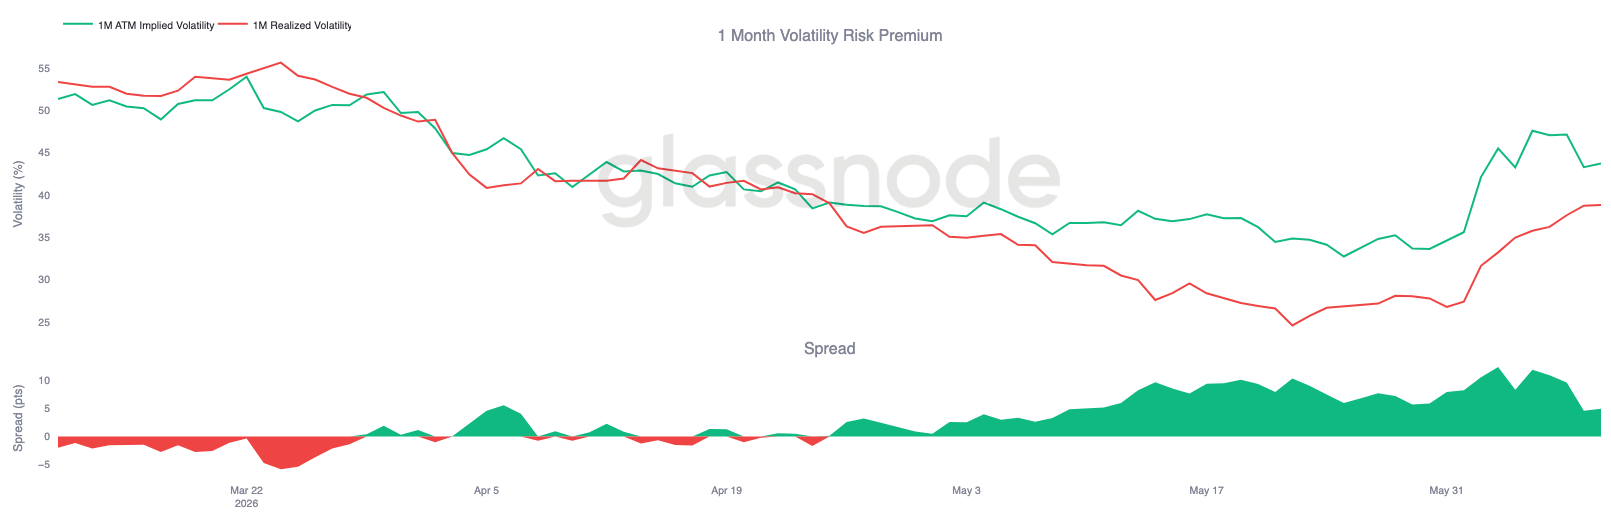
Following the sharp repricing in implied volatility, the relationship between implied and realized volatility shows that options markets continue to price more movement ahead than spot has recently delivered.
One month implied volatility climbed from around 35% to 44%, while realized volatility also moved higher, rising from roughly 27% to 39% during the selloff. Although both measures reacted to the breakdown, implied volatility increased more aggressively, keeping the volatility risk premium positive.
The chart shows that the spread briefly widened above 10 volatility points as traders rushed to reprice uncertainty following the break below support. While that gap has narrowed, options continue to trade at a premium to realized volatility.
This suggests the market is assigning value to the possibility of further volatility ahead.
Options markets continue to price a higher level of future uncertainty than recent realized moves alone would justify, keeping the volatility risk premium elevated.
25 Delta Skew Reprices Sharply Higher
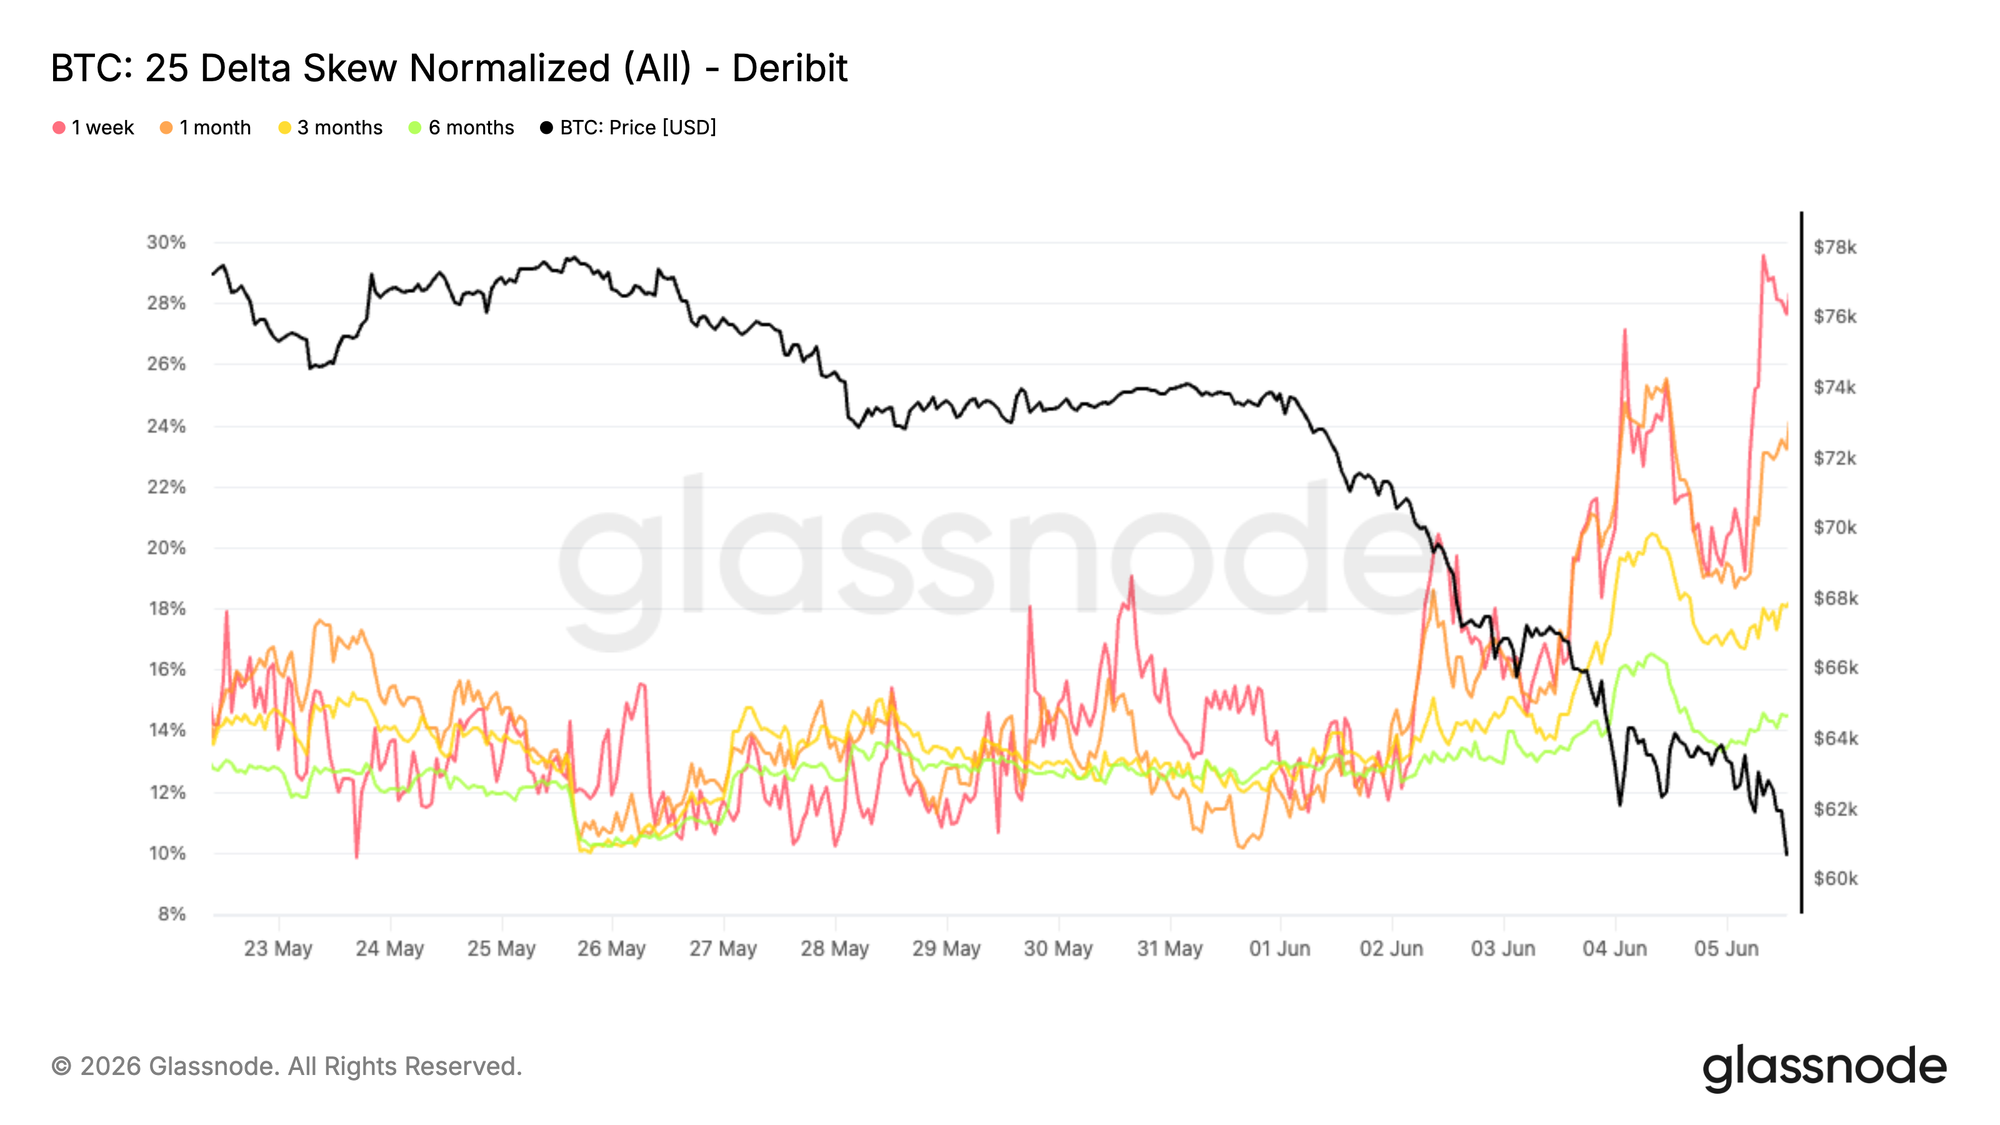
Following the rise in volatility premiums, skew shows where that demand has been concentrated. As Bitcoin broke below support and traded toward the February lows, traders increasingly favored downside protection.
Since skew is calculated as put volatility minus call volatility, positive readings indicate that puts trade at a premium to equivalent calls. The recent move lower triggered a sharp repricing across maturities, with the 1 month skew rising from around 11% to 24%, while the 3 month and 6 month tenors climbed toward 18% and 14%, respectively.
The front end saw the strongest reaction, with the 1 week skew briefly approaching 30% as demand for near term protection accelerated during the selloff. Unlike implied volatility, which rose across the surface, skew highlights a directional response focused on downside hedging.
Protection demand has strengthened materially, with traders paying increasingly higher premiums for downside insurance as market conditions deteriorated.
Gamma Exposure Builds Around 65K
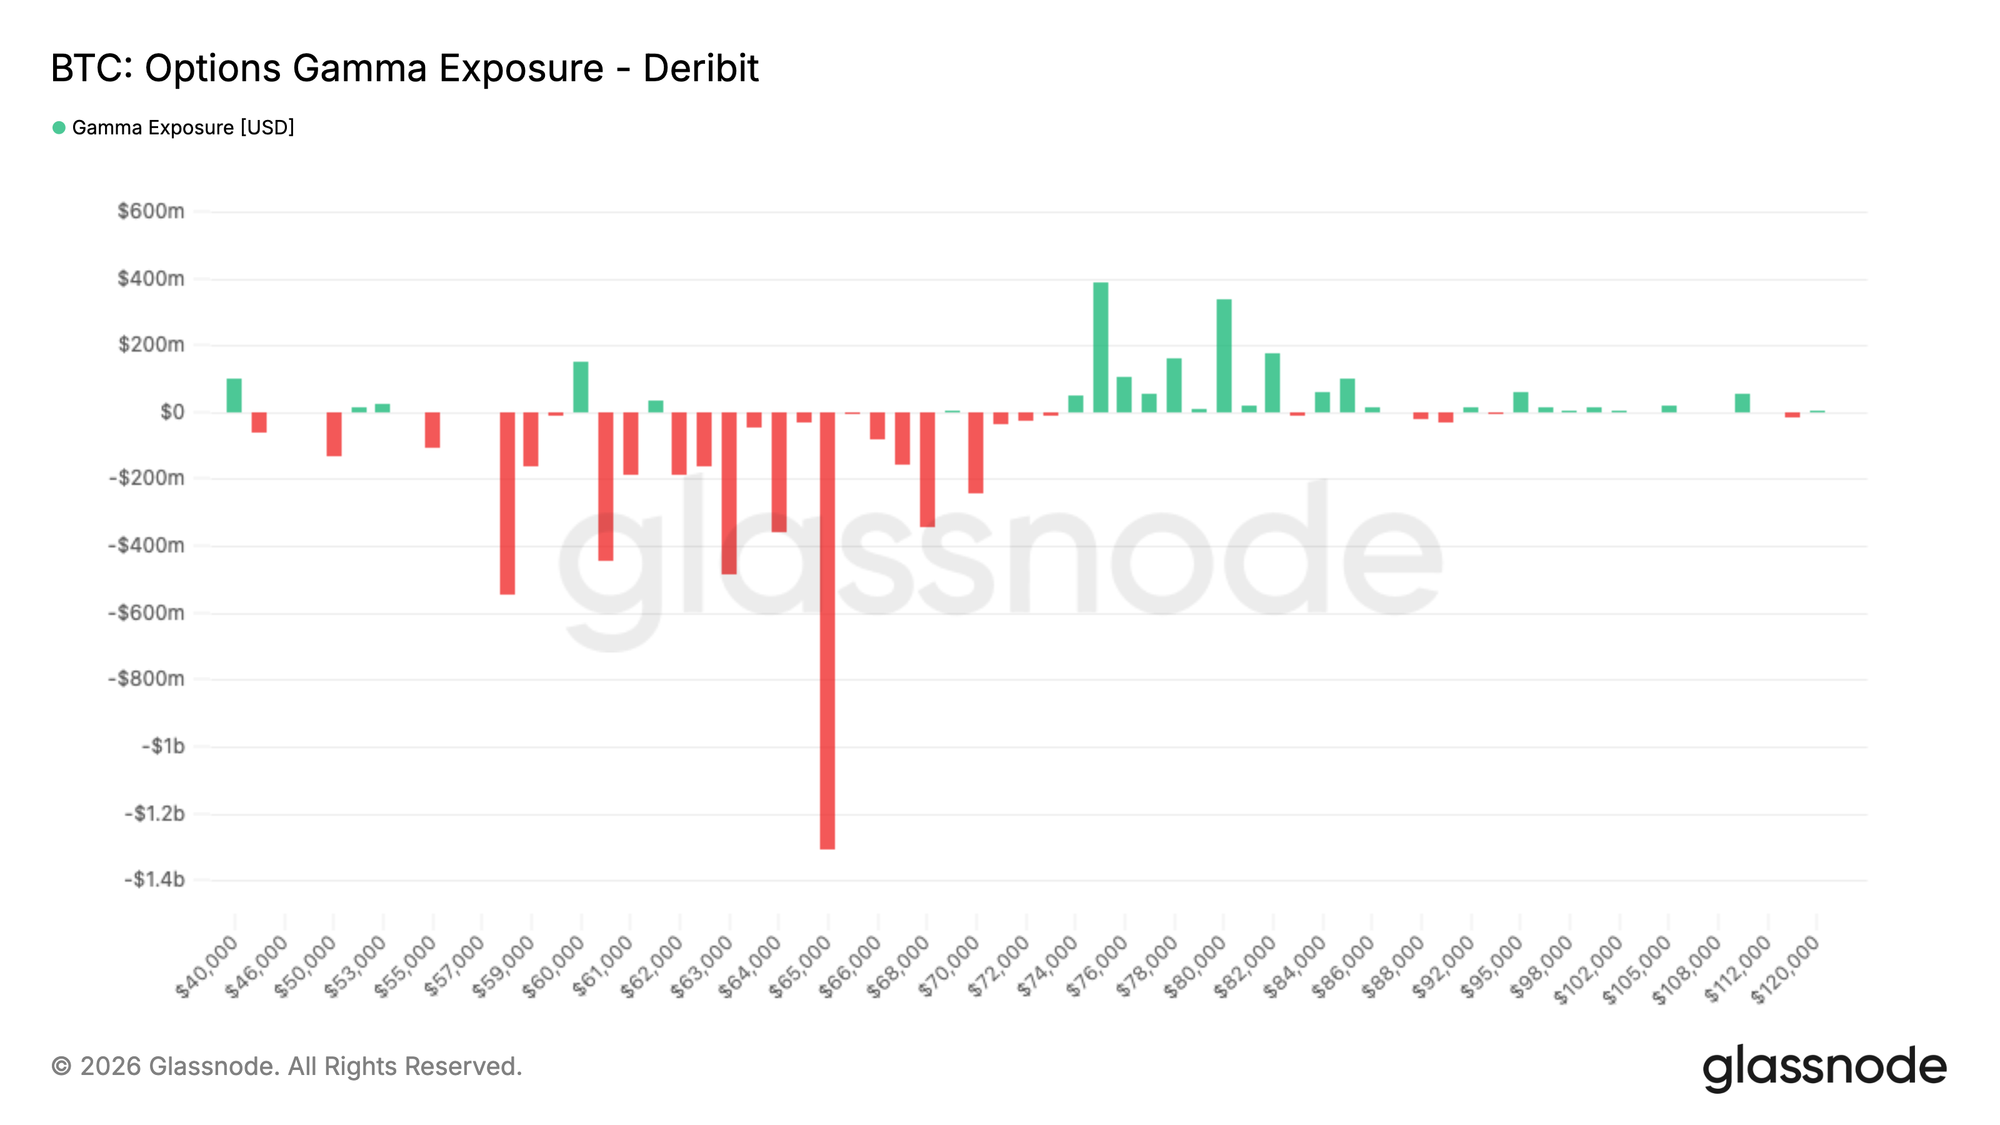
Beyond pricing, gamma exposure helps identify the strike levels where dealer hedging may have the greatest impact on market dynamics.
Recent flow has remained defensive. Over the past seven days, put buying represented the largest share of premium traded at 32.4%, while the last 24 hours show a similar pattern, with put buying rising to 35.9% of premium traded. Demand for downside protection continues to dominate activity despite the recent selloff.
This positioning is reflected in the gamma profile. The largest negative gamma cluster now sits at 65K, with additional negative gamma exposure extending from 59K to 70K. With Bitcoin currently trading near 62K, spot remains just below the largest concentration of short gamma. Positive gamma exposure is concentrated much higher, mainly between 76K and 82K.
Defensive flow continues to shape dealer positioning, leaving the largest negative gamma zone concentrated around 65K and close to current spot levels.
Conclusion
The market continues to exhibit characteristics of a late-stage correction, with recent buyers deeply underwater, realized losses elevated, and several key sources of demand weakening materially.
The breakdown toward $60K triggered a significant deleveraging event, flushing a large concentration of speculative positioning from the market. While this has helped reset leverage conditions, it has yet to be met by a meaningful resurgence in spot demand.
Options markets remain defensively positioned, with elevated implied volatility, strong demand for downside protection, and dealer positioning concentrated near current spot levels. Combined with fading institutional participation and softer corporate treasury accumulation, the data suggests risk appetite remains subdued.
Taken together, the market appears to be progressing deeper into a capitulation phase. While leverage has largely been reset and valuation metrics have reached historically discounted levels, the demand response typically associated with durable market lows has yet to emerge.
Disclaimer: The content of this article solely reflects the author's opinion and does not represent the platform in any capacity. This article is not intended to serve as a reference for making investment decisions.
You may also like
As chip stocks plummet, "cybersecurity software" surges across the board, CrowdStrike and Palo Alto Networks hit new highs
CrowdStrike surged 13.8% in a single day to a record high, while Palo Alto Networks soared 13%. The software ETF outperformed the semiconductor ETF by more than 10 percentage points in a single day, marking the largest gap in history. Analysts believe that regardless of the pace of AI development, security demand will only continue to rise. Capital is accelerating its rotation from computing hardware to security software, with segments such as identity management and data governance expected to benefit first.
Altman can afford to wait, but Masayoshi Son can't: OpenAI will not go public this year, exposing a $20 billion gap and a credit weakness for SoftBank.
OpenAI has postponed its public listing, putting its largest external shareholder, SoftBank, in a liquidity crisis. This week, SoftBank is conducting a roadshow in New York, seeking to issue $10-20 billion in bonds to repay the $40 billion bridge loan previously borrowed to increase its investment in OpenAI. According to Bloomberg estimates, SoftBank faces a funding gap of at least $20 billion, and the yield on its existing U.S. dollar bonds has already exceeded 8.5%, with pricing approaching junk status.
Meeting postponed, gold price drops rapidly
The "first metaverse stock" bets on "AI-powered game creation"! Roblox (RBLX.US) competes for creator economy dividends, shares surge nearly 13%
On September 11, after Roblox announced new tools for game developers and features for players at its developer conference, the company's stock price rose by more than 12% on Monday.

Crypto prices
More


