Bitget App
Trade smarter
Buy cryptoMarketsTradeFuturesEarnAISquareMore
Forget the price charts. Here's how bitcoin and S&P 500 look like when adjusted for the money printer

Forget the price charts. Here's how bitcoin and S&P 500 look like when adjusted for the money printer

CryptoNewsNetCryptoNewsNet2026/06/17 06:57
By:CryptoNewsNet
Back to the list

Forget the price charts. Here's how bitcoin and S&P 500 look like when adjusted for the money printer

Forget the price charts. Here's how bitcoin and S&P 500 look like when adjusted for the money printer image 0  coindesk.com 4 m
Forget the price charts. Here's how bitcoin and S&P 500 look like when adjusted for the money printer image 1

If you're only looking at the dollar price of your portfolio, you may be missing part of the picture, which is significantly shaped by money supply growth.

To the casual observer, the markets look like business as usual. While bitcoin has nearly halved to $66,000 since its $126,000 peak in October of last year, the decline could be dismissed as just another brutal, quadrennial crypto bear market. Meanwhile, the S&P 500 continues to hover near record highs.

But beneath the surface, a more interesting signal emerges when both prices are adjusted for the U.S. M2 money supply. M2 is the Federal Reserve's estimate of liquid assets, including cash on hand, money deposited in checking and savings accounts, and other short-term saving vehicles such as money market funds and certificates of deposit.

Monetary exhaustion?

Some observers see bitcoin as a high-beta barometer for dollar liquidity, and the $BTC/M2 ratio, bitcoin's price adjusted for money supply growth, is now flashing a warning. The ratio, after a sharp climb from 2023 through 2025, appears to have formed what technical analysts call a head-and-shoulders pattern, typically read as a bearish signal.
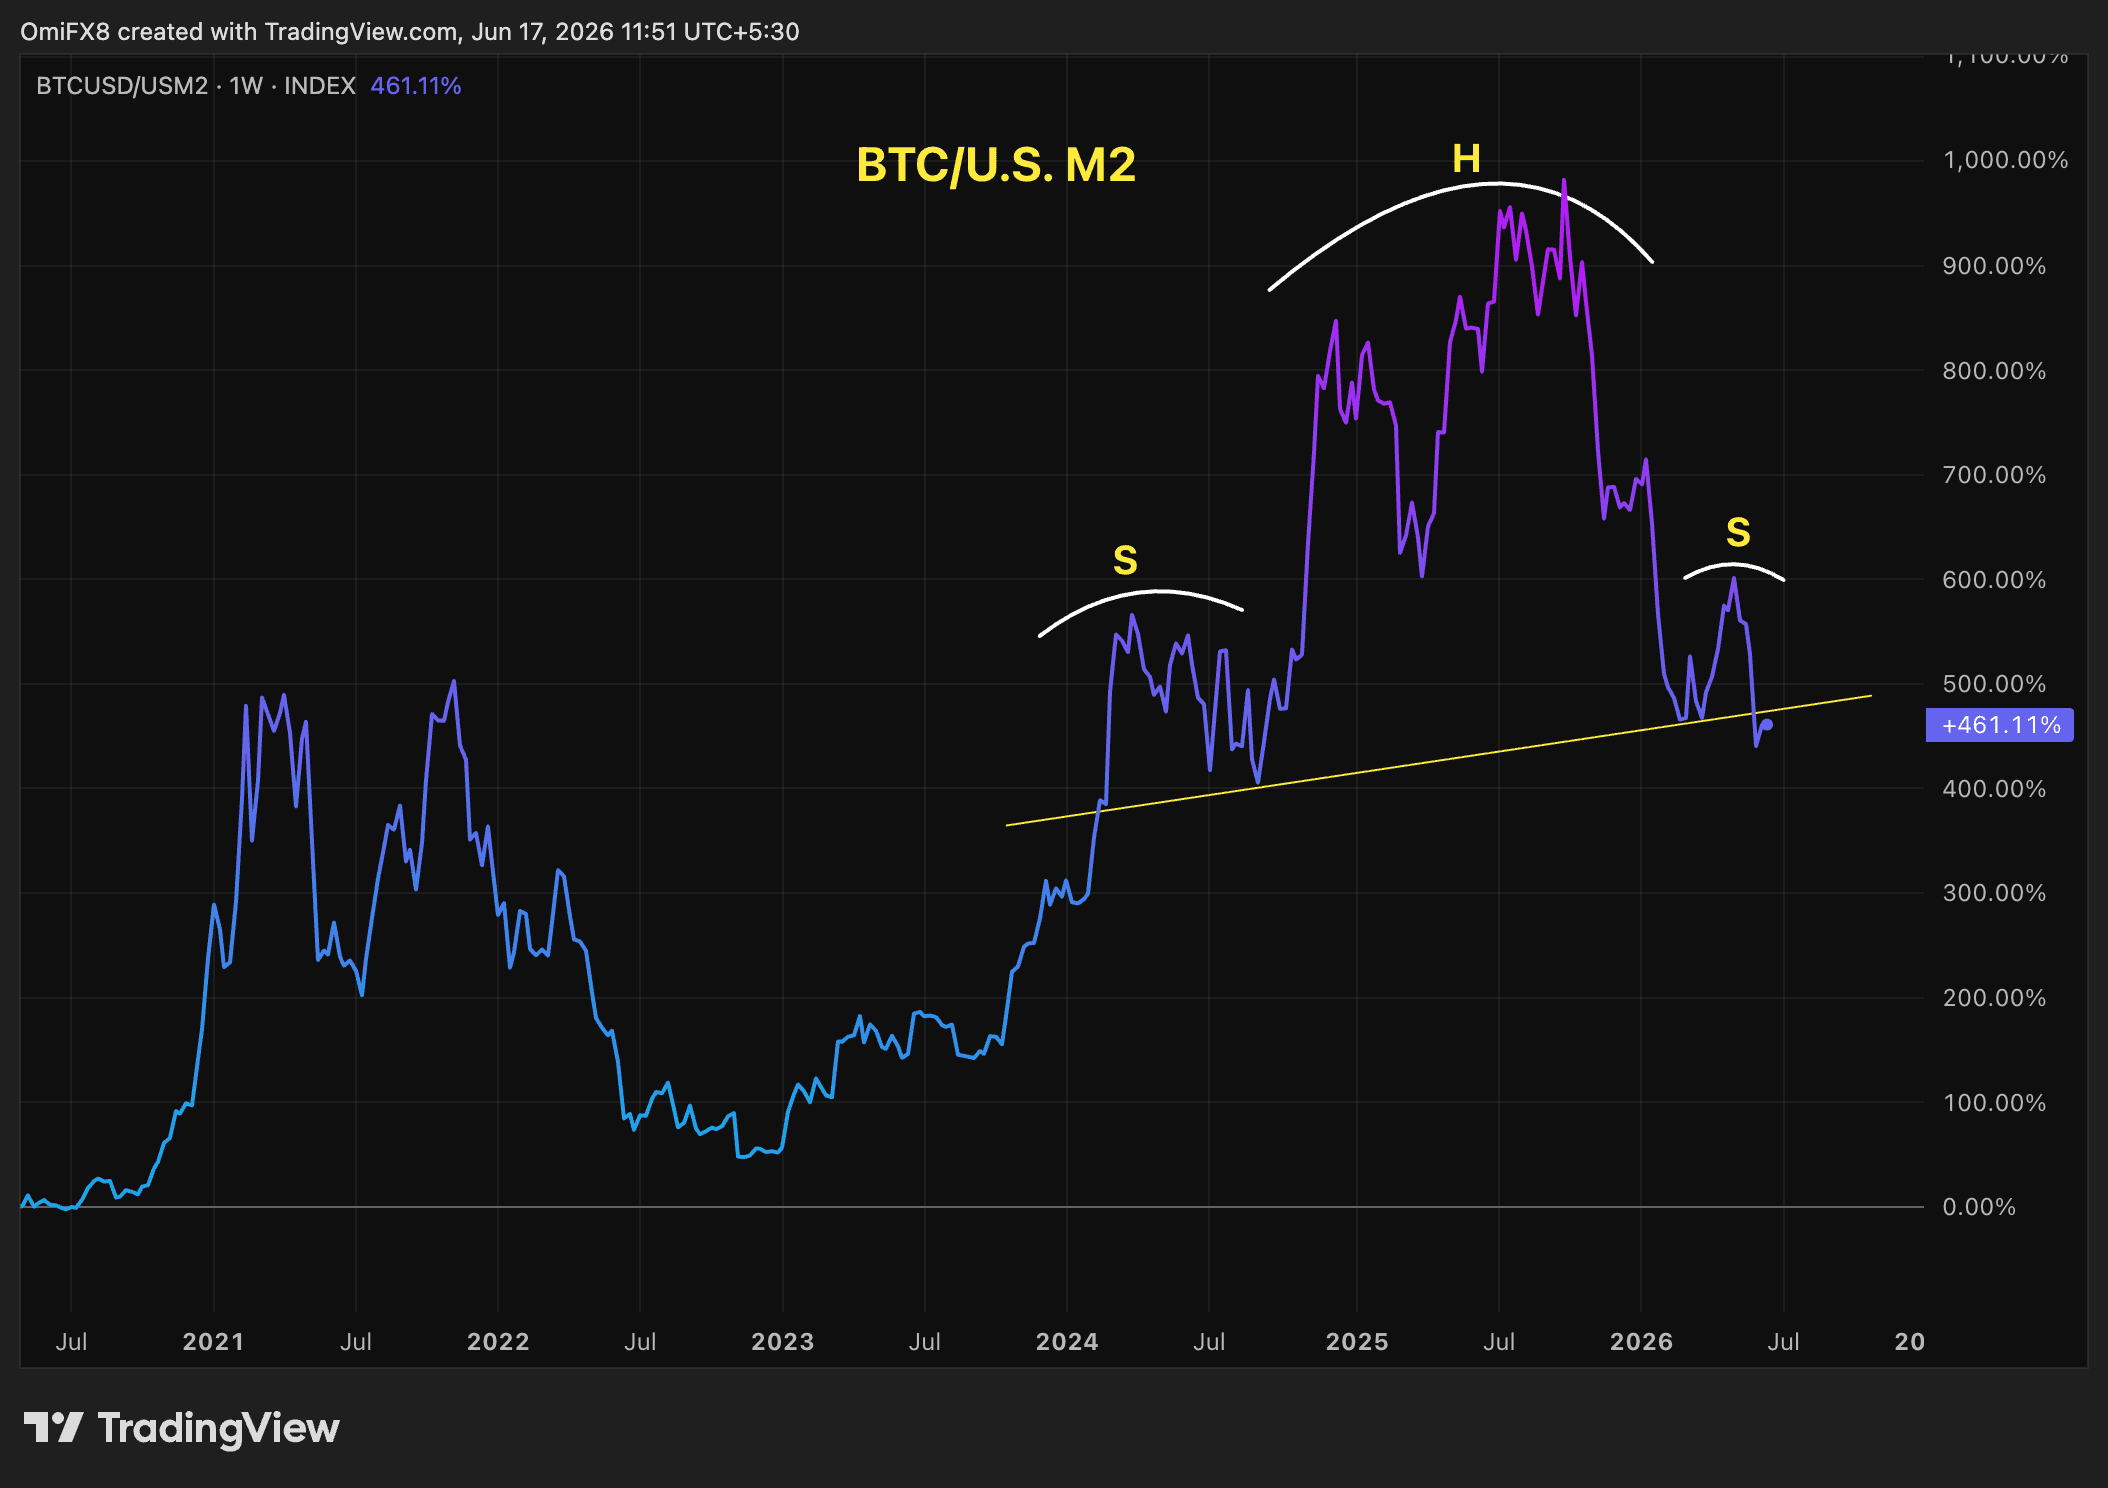
Forget the price charts. Here's how bitcoin and S&P 500 look like when adjusted for the money printer image 2 $BTC's price-to-U.S. M2 money supply. (TradingView)

If the pattern holds, it would suggest bitcoin's exponential edge over money supply growth — the dynamic that let it outrun debasement so convincingly in prior cycles — is fading. Bitcoin's ability to outpace the flood of new dollars may be approaching diminishing returns, at least for now.

That matters beyond crypto. Bitcoin has at times been viewed as a leading indicator for broader risk appetite, and the S&P 500's own money-supply-adjusted valuation tells a story that looks very different from its nominal price.
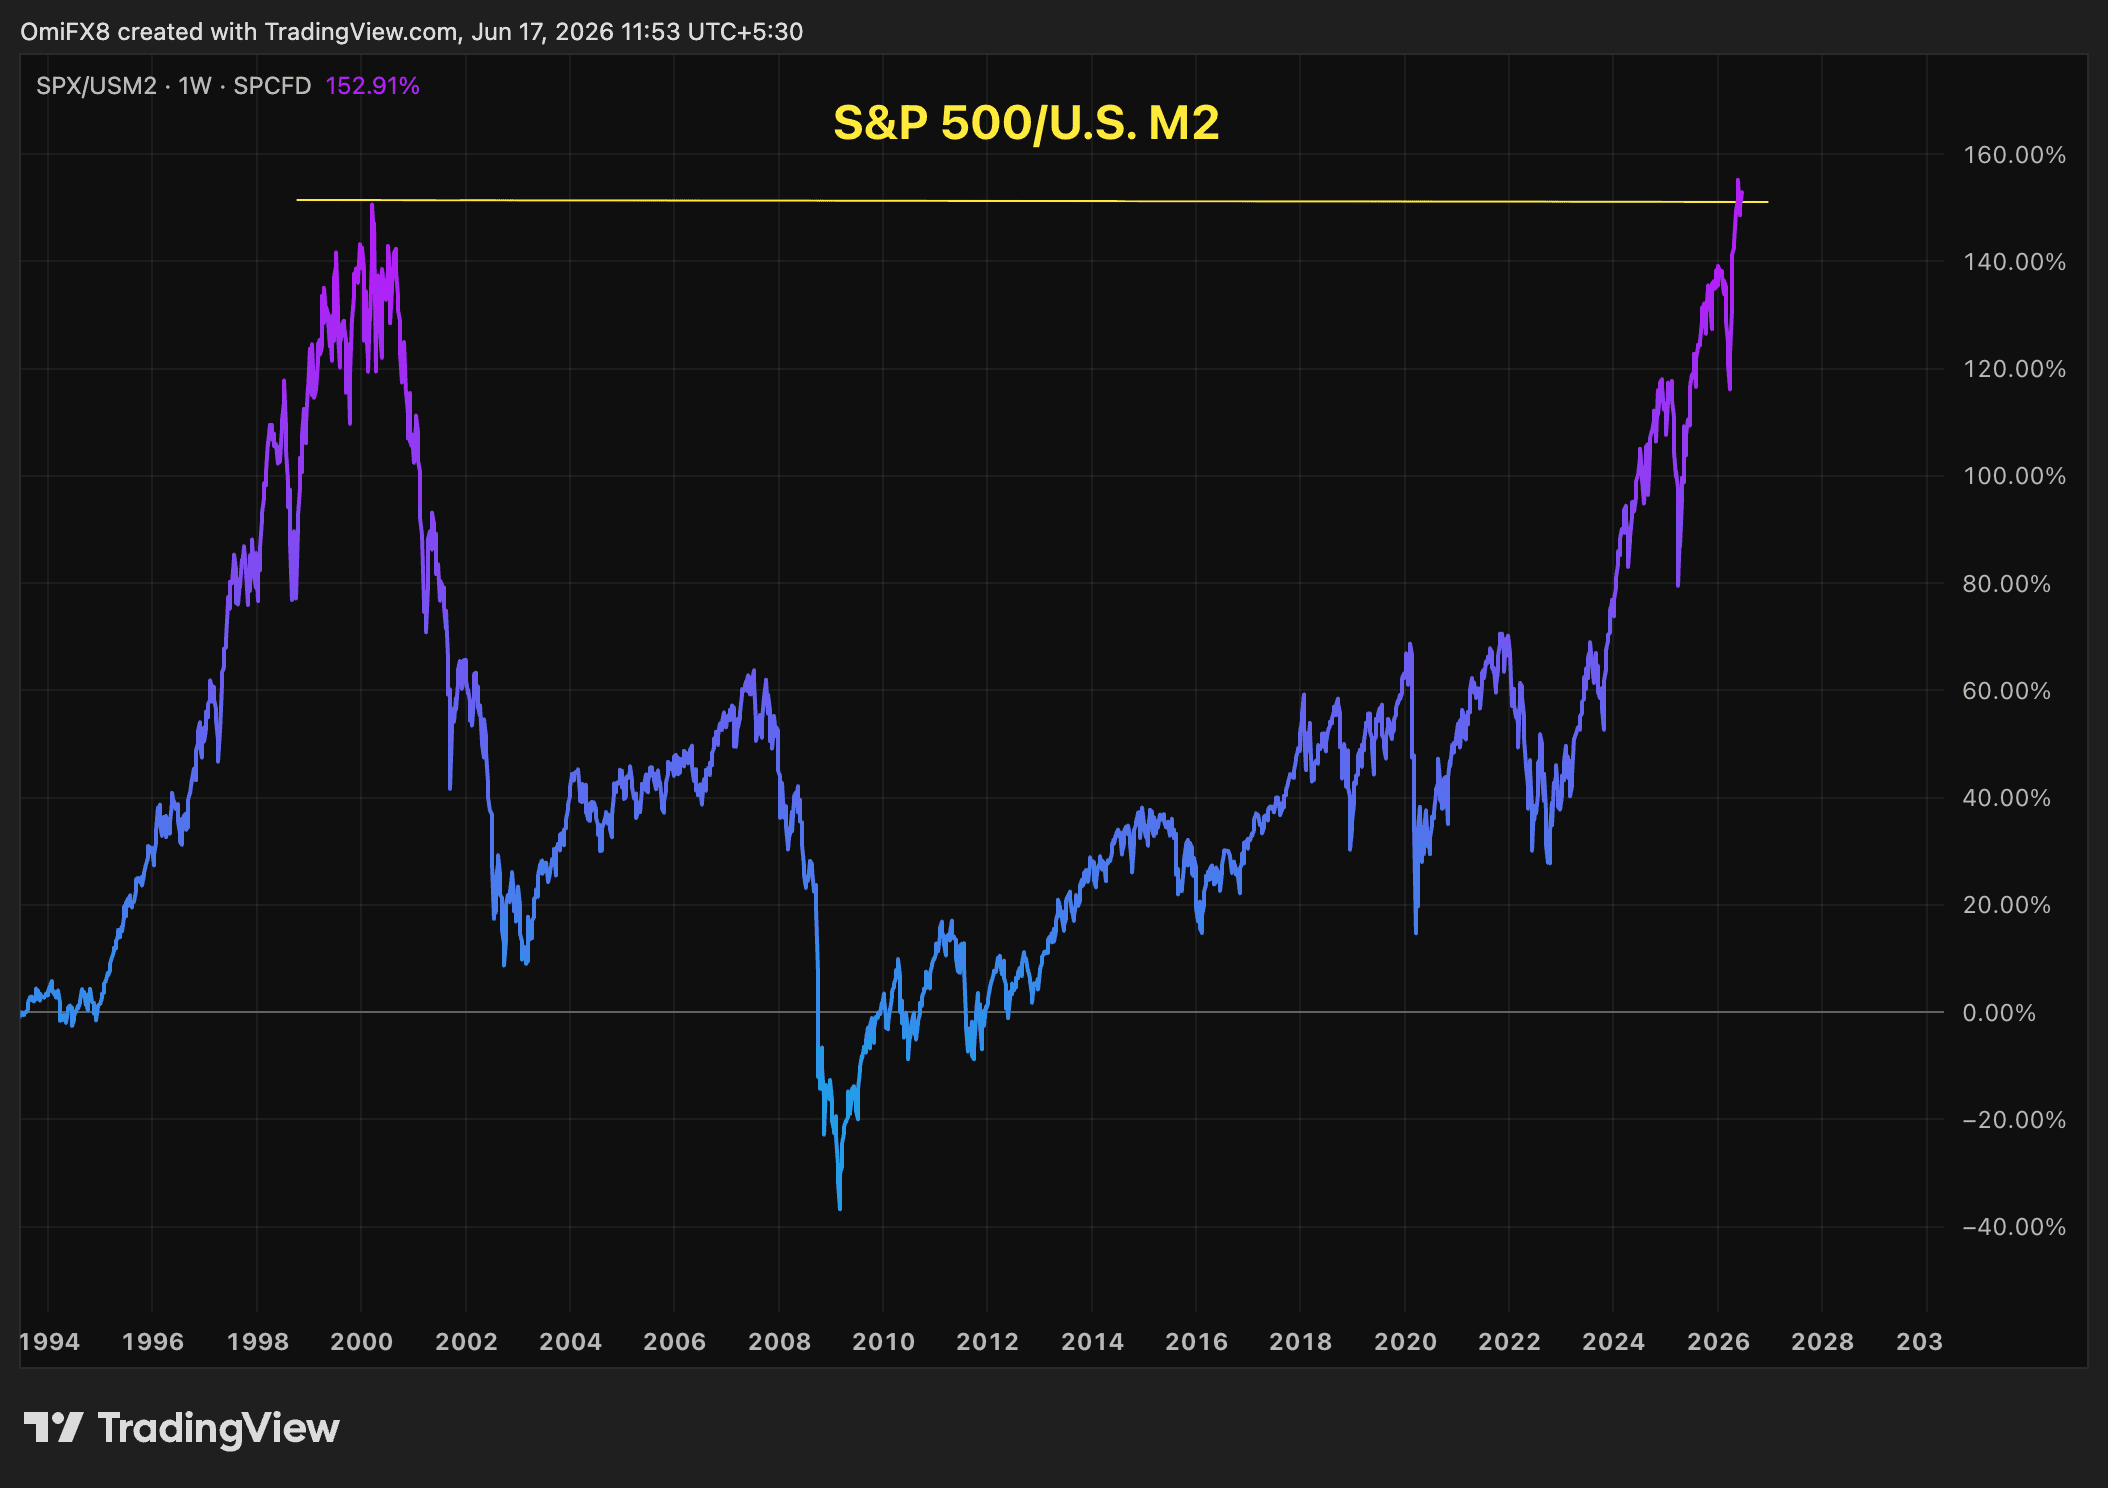
Forget the price charts. Here's how bitcoin and S&P 500 look like when adjusted for the money printer image 3 S&P 500-to-U.S. M2 (TradingView)

The index currently hovers near a record high of 7,511 points, well above its 2000 peak of around 1,500 points in nominal terms. But adjusted for two decades of M2 growth, the S&P 500 has only recently reclaimed that 2000-era high. That doesn't necessarily mean equities are as overextended as they were at the height of the dot-com bubble, as corporate earnings today are generally considered stronger and more durable compared to 1999-2000.

But on this specific money-supply-adjusted basis, it has taken a quarter-century of money-supply expansion just to get the index's monetary-adjusted valuation back to where it stood at the height of the dot-com bubble. In other words, every new dollar added to the system has had to work harder for a relatively smaller marginal gain in valuation.

The takeaway

Bitcoin has at times moved ahead of broader macro turns. If its monetary valuation is genuinely losing ground to M2 growth, it could be an early warning that the S&P 500's nominal gains rest on a thinner foundation than they appear.
0
0

Disclaimer: The content of this article solely reflects the author's opinion and does not represent the platform in any capacity. This article is not intended to serve as a reference for making investment decisions.

Understand the market, then trade.
Bitget offers one-stop trading for cryptocurrencies, stocks, and gold.
Trade now!

You may also like

As chip stocks plummet, "cybersecurity software" surges across the board, CrowdStrike and Palo Alto Networks hit new highs

CrowdStrike surged 13.8% in a single day to a record high, while Palo Alto Networks soared 13%. The software ETF outperformed the semiconductor ETF by more than 10 percentage points in a single day, marking the largest gap in history. Analysts believe that regardless of the pace of AI development, security demand will only continue to rise. Capital is accelerating its rotation from computing hardware to security software, with segments such as identity management and data governance expected to benefit first.

华尔街见闻2026/09/15 00:16

Altman can afford to wait, but Masayoshi Son can't: OpenAI will not go public this year, exposing a $20 billion gap and a credit weakness for SoftBank.

OpenAI has postponed its public listing, putting its largest external shareholder, SoftBank, in a liquidity crisis. This week, SoftBank is conducting a roadshow in New York, seeking to issue $10-20 billion in bonds to repay the $40 billion bridge loan previously borrowed to increase its investment in OpenAI. According to Bloomberg estimates, SoftBank faces a funding gap of at least $20 billion, and the yield on its existing U.S. dollar bonds has already exceeded 8.5%, with pricing approaching junk status.

华尔街见闻2026/09/15 00:16

Meeting postponed, gold price drops rapidly

汇通财经2026/09/14 23:36
Meeting postponed, gold price drops rapidly

The "first metaverse stock" bets on "AI-powered game creation"! Roblox (RBLX.US) competes for creator economy dividends, shares surge nearly 13%

On September 11, after Roblox announced new tools for game developers and features for players at its developer conference, the company's stock price rose by more than 12% on Monday.

智通财经2026/09/14 23:31
The "first metaverse stock" bets on "AI-powered game creation"! Roblox (RBLX.US) competes for creator economy dividends, shares surge nearly 13%