u.today
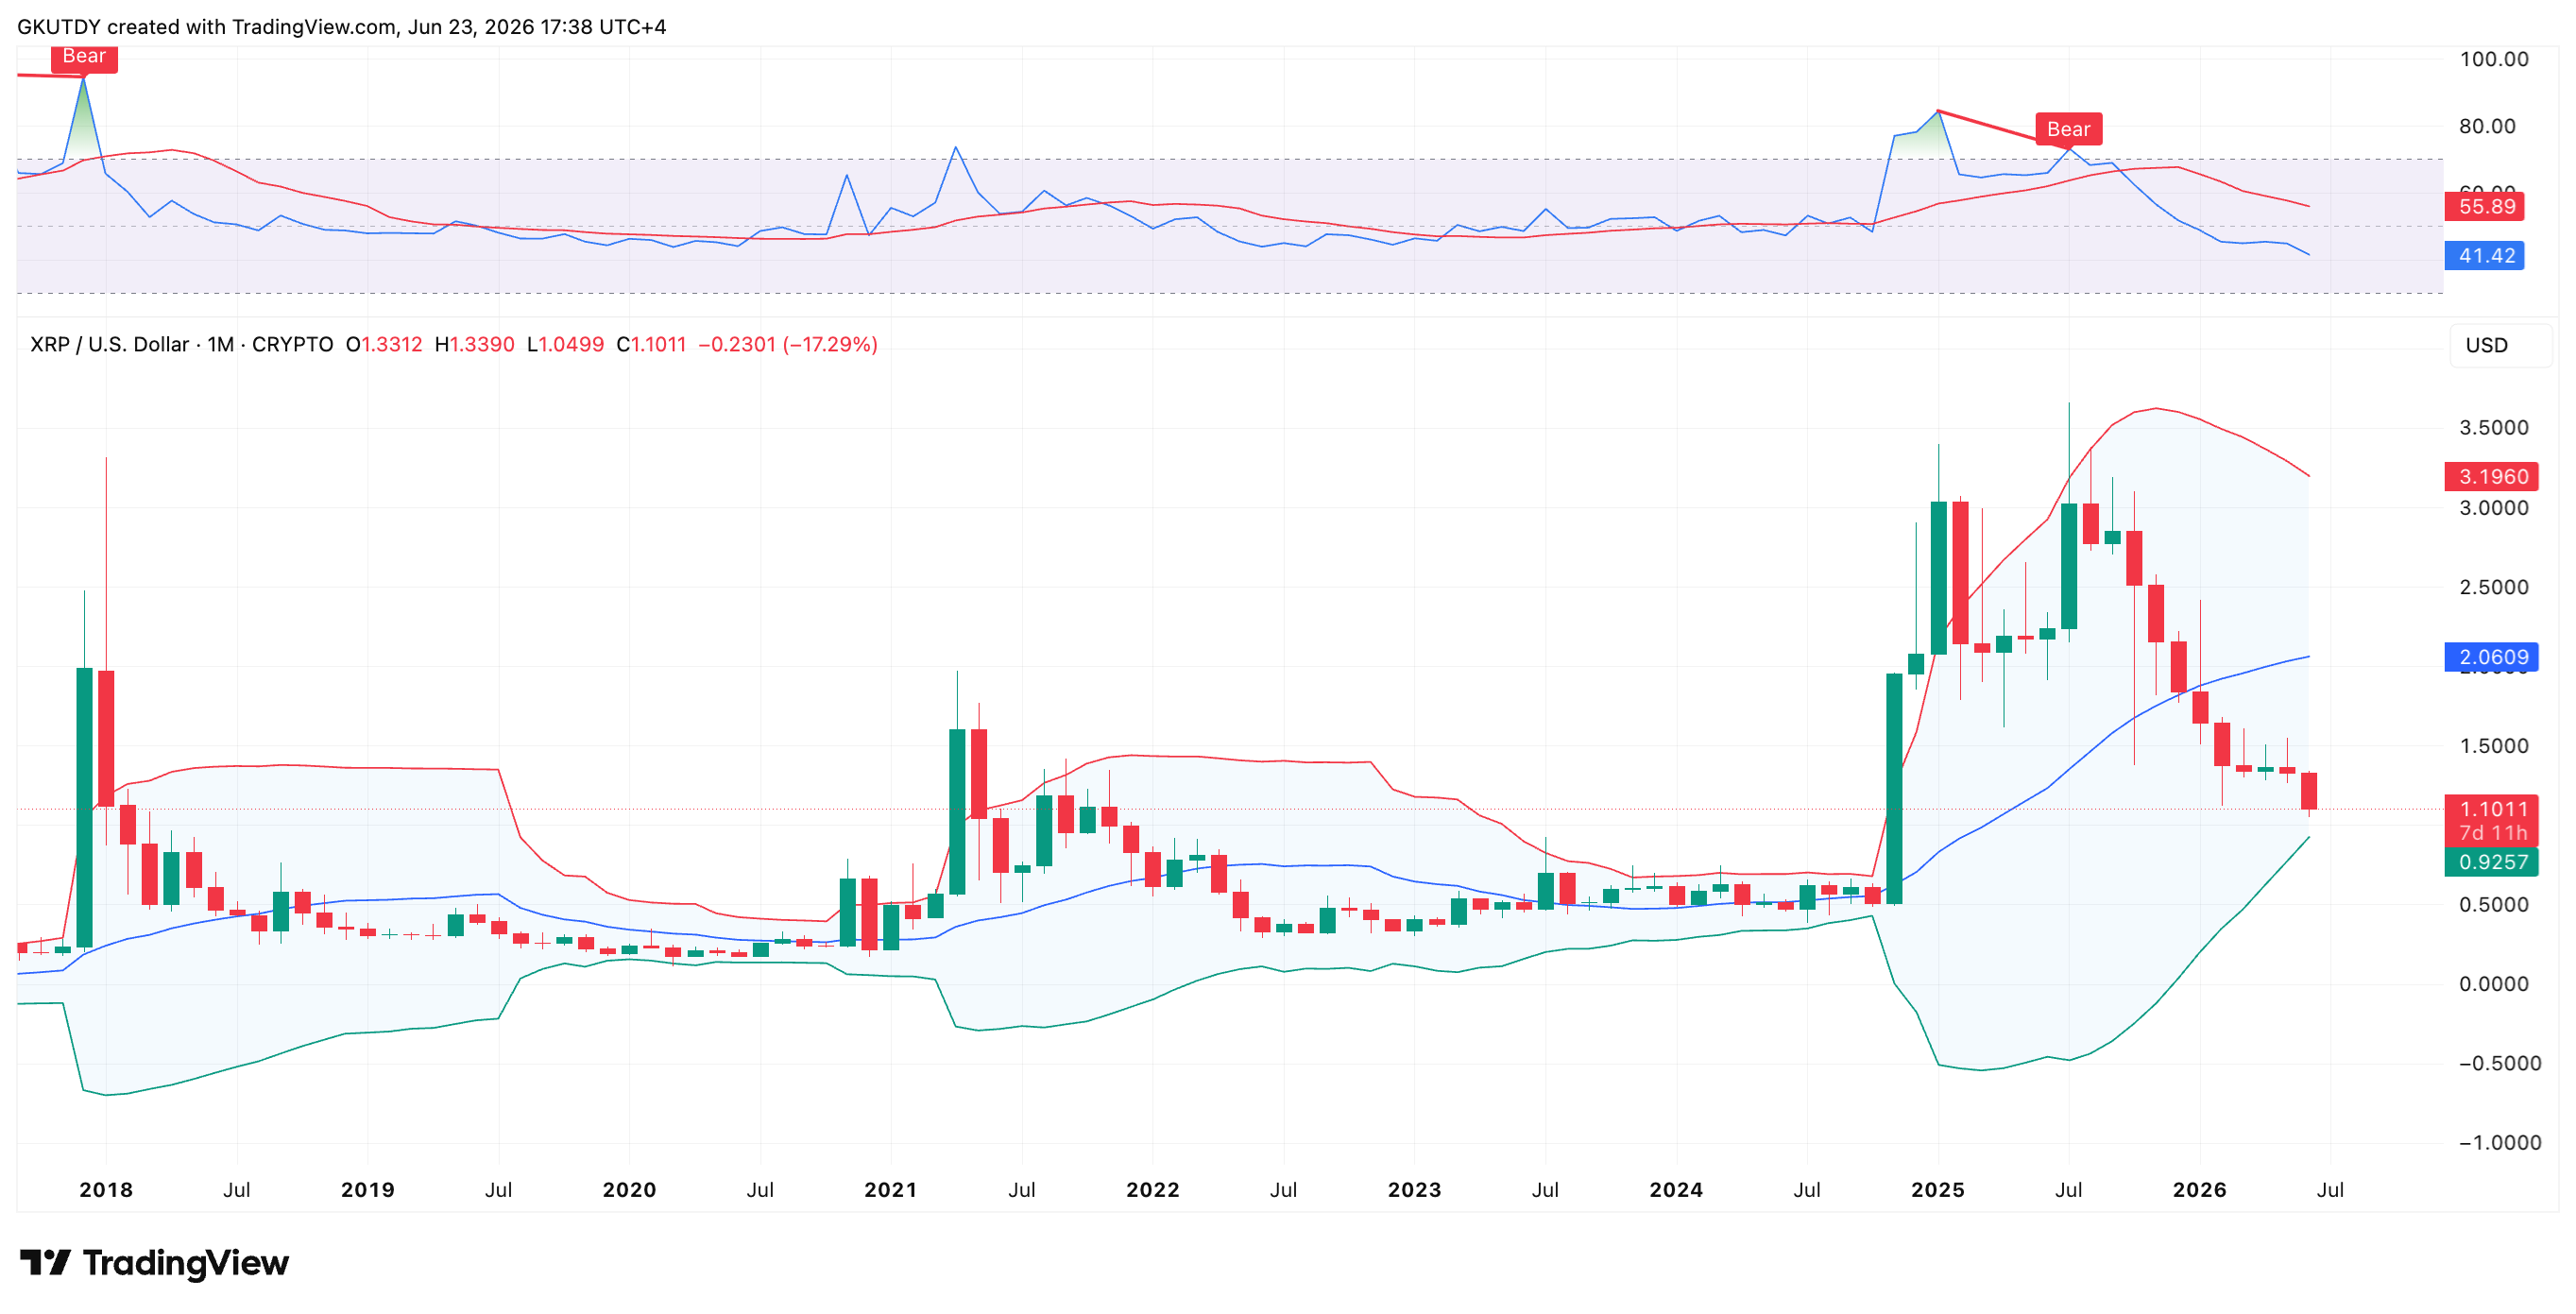
Three months of harsh consolidation and record-low volatility on $XRP's monthly chart in TradingView have ended with a powerful breakdown. The Bollinger Bands, whose borders compressed into a narrow corridor over the spring, have now expanded to the downside.
June has brought a 16.98% decline, turning the indicator's lower band into the main price reference point for the market. The middle line (20-month SMA) remains far above at $2.06.
Since $XRP broke this level from above, sellers have fully seized the initiative. This is why the lower boundary near $0.92 is currently acting as a powerful price magnet, pulling technical targets below the dollar mark.
 $XRP price monthly chart with Bollinger Bands, Source:
TradingView
$XRP price monthly chart with Bollinger Bands, Source:
TradingView
A clear consensus is forming in the market. Before discussing a return to $2, the coin will first test the strength of buyers and the density of orders below the psychological $1 level.
The current breakdown is not just a local failure, but a continuation of a heavy trend that has followed the coin since the beginning of the year. This ongoing slide technically explains why the Bollinger Bands indicator is pointing to new lows.
The entire first half of 2026 is proving depressing for holders of the asset. January and February immediately set a bearish tone by closing deep in negative territory.
A short pause and an attempted rebound in April have been completely erased by the subsequent spring slide in price. Looking at the quarterly history, $XRP is going through one of its worst periods in recent years.
The coin closed the first quarter having lost more than a quarter of its value. Meanwhile, the current second quarter is only worsening the situation, showing a double-digit decline.
The market is facing a systemic outflow of liquidity. The prolonged regulatory deadlock around the Clarity Act in the U.S. Senate is forcing major players to de-risk.
The last line for $XRP bulls
At the moment, the last line of defense remains the local support block in the $1.05–$1.10 range. The only factor keeping $XRP from an immediate breakdown is the stable inflow of capital into spot $XRP ETFs.
Net assets of these funds are currently hovering around $1.35–$1.45 billion. However, if June's monthly candle closes below $1.00, a move toward the lower Bollinger Band at $0.92–$0.96 will become technically inevitable.
Historically, June rarely rewards $XRP buyers with major upside moves. In the coming weeks, the market will have to search for a real bottom.