
A visual overview of commodity support and resistance: Gold, Silver, Oil, Gas + Platinum, Palladium, Copper, and Agricultural Futures (June 26, 2026)

Huitong Finance June 26 —— A chart showing commodity support and resistance: Gold, silver, oil and gas + platinum, palladium, copper + agricultural futures. Last updated on Friday, June 26, 2026, at 07:15. It specifically covers 14 varieties, including gold, silver, platinum, palladium, copper + crude oil, natural gas, fuel oil + wheat, corn, cotton. For more details, please refer to the Huitong Finance custom chart.
A chart showing commodity support and resistance: Gold, silver, oil and gas + platinum, palladium, copper + agricultural futures. Last updated on Friday, June 26, 2026, at 07:15. It specifically covers 14 varieties, including gold, silver, platinum, palladium, copper + crude oil, natural gas, fuel oil + wheat, corn, cotton. For more details, please refer to the content of the Huitong Finance custom chart.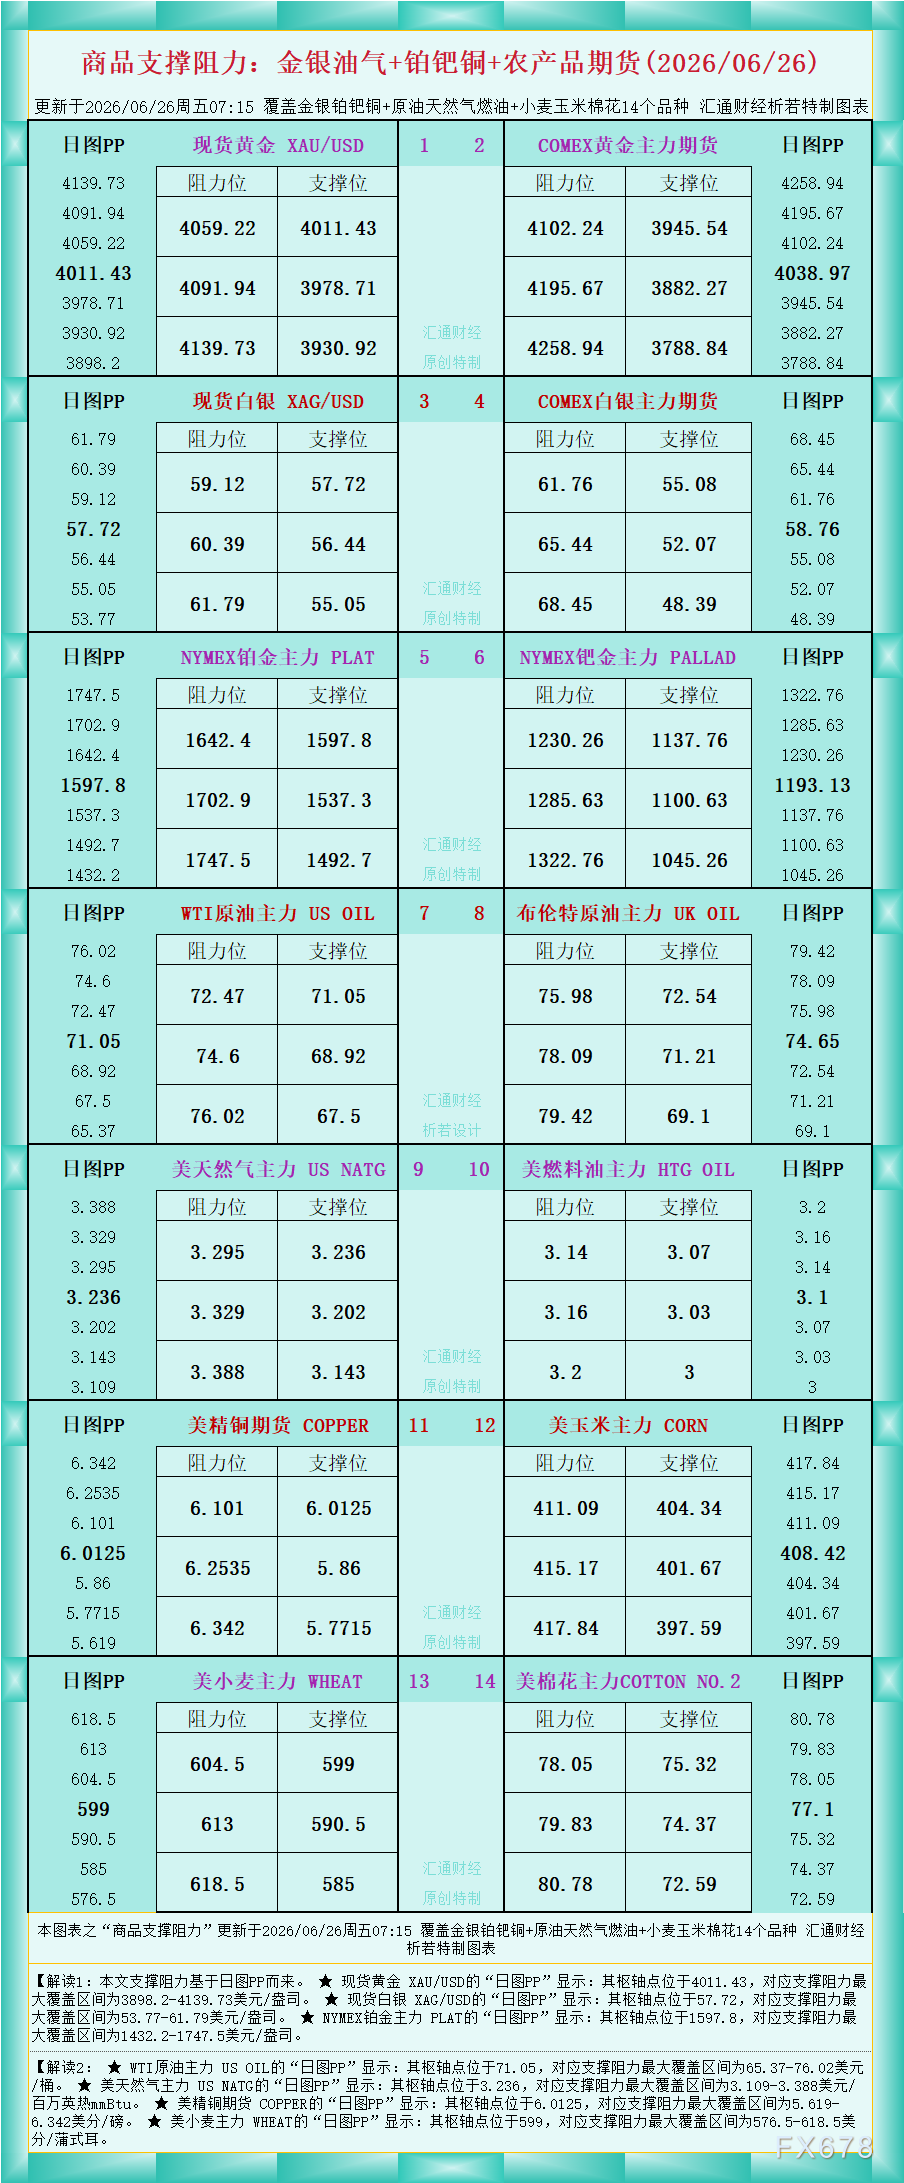
According to the chart data, Interpretation 1: The support and resistance in this article are based on the daily chart PP.
★ The daily chart PP for spot gold XAU/USD shows: its pivot point is at 4011.43, with the largest support and resistance range covered between $3898.2–$4139.73/oz.
★ The daily chart PP for spot silver XAG/USD shows: its pivot point is at 57.72, with the largest support and resistance range covered between $53.77–$61.79/oz.
★ The daily chart PP for NYMEX platinum main contract PLAT shows: its pivot point is at 1597.8, with the largest support and resistance range covered between $1432.2–$1747.5/oz.
Interpretation 2:
★ The daily chart PP for WTI crude oil main contract US OIL shows: its pivot point is at 71.05, with the largest support and resistance range covered between $65.37–$76.02/barrel.
★ The daily chart PP for US natural gas main contract US NATG shows: its pivot point is at 3.236, with the largest support and resistance range covered between $3.109–$3.388/million British thermal units mmBtu.
★ The daily chart PP for US copper futures COPPER shows: its pivot point is at 6.0125, with the largest support and resistance range covered between 5.619–6.342 cents/pound.
★ The daily chart PP for US wheat main contract WHEAT shows: its pivot point is at 599, with the largest support and resistance range covered between 576.5–618.5 cents/bushel.
For more interpretations on other varieties, please refer to the chart.
Disclaimer: The content of this article solely reflects the author's opinion and does not represent the platform in any capacity. This article is not intended to serve as a reference for making investment decisions.
You may also like
Pushing Forward Against the "AI Slowdown" Trend? Reports Suggest Kioxia Plans U.S. IPO to Raise at Least $10 Billion
Kioxia is reportedly considering raising $10 billion through a listing in the United States.

3 Altcoins Poised to Pump Soon: LTC, TRX, ADA

AI Computing Power Construction Shifts from "Lack of Electricity" to "Lack of Talent": Modularization Rises, Schneider, Vertiv, Eaton Embrace New Opportunities
Bernstein recently released a research report stating that, amid the rapid expansion of AI computing power, the main constraint affecting the development of data centers is undergoing a shift.

Zcash slides from $1,300, risk of $850 pullback before new rally
Crypto prices
More


