


Dogecoin is testing the $0.073 support zone as both short-term and long-term charts point to a possible rebound. However, losing this level could invalidate the bullish setups and expose $DOGE to further losses.
Dogecoin Flashes Buy Signal as $0.073 Support Comes Into Focus
Dogecoin has printed a TD Sequential buy signal on the daily chart after a sharp decline pushed the price toward the $0.075 area.
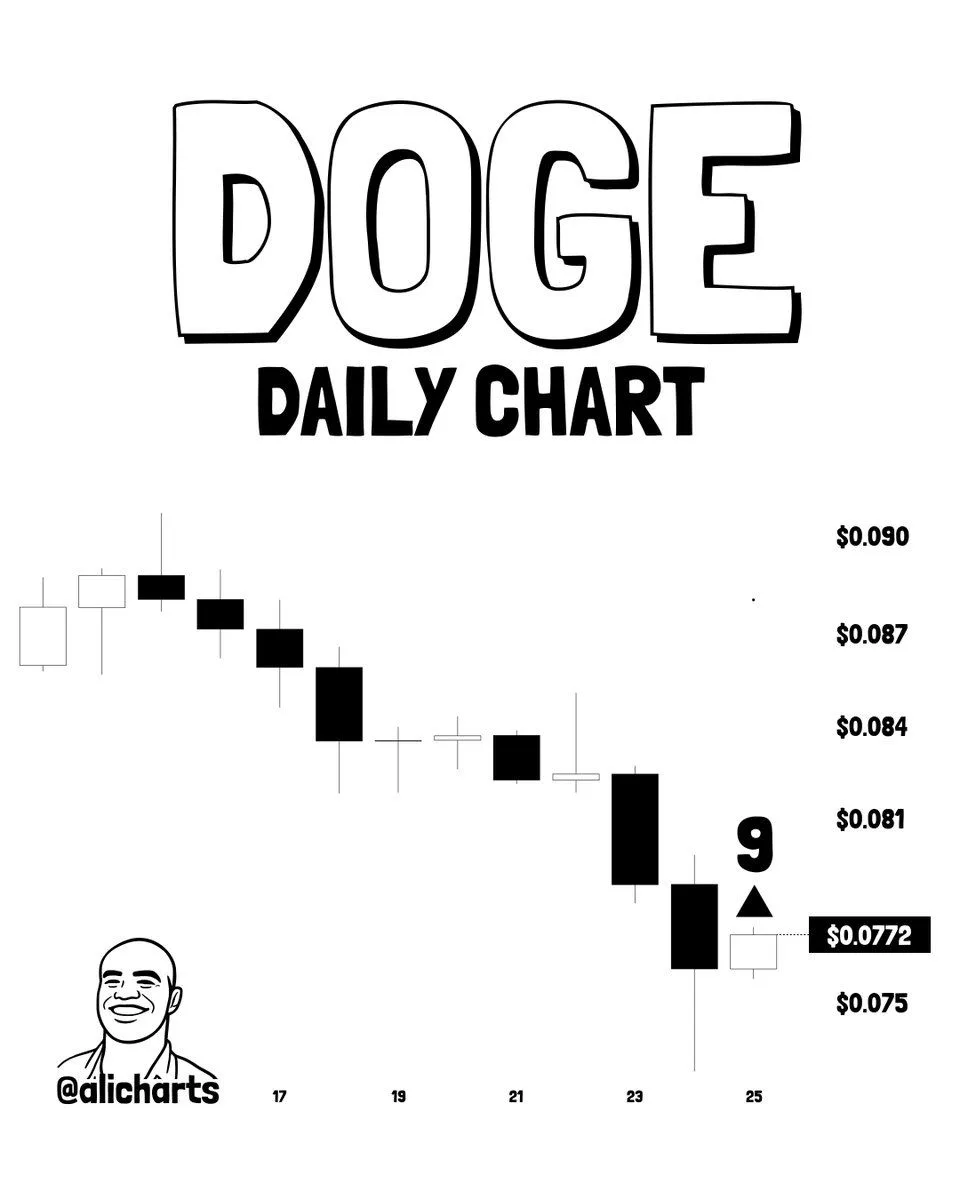
$DOGE/USD Daily Chart With TD Sequential Buy Signal. Source:
The indicator’s “9” signal suggests selling pressure may be losing momentum and a short-term rebound could follow. $DOGE is trading near $0.0772, with $0.081 acting as the first major upside target. A move above that level could open the door to the $0.084 resistance zone.
However, Dogecoin remains in a broader short-term downtrend, with the chart showing lower highs and lower lows. The bullish setup depends on $DOGE holding the $0.073 support level. A daily close below that price would invalidate the signal and increase the risk of further losses.
Dogecoin Tests Long-Term Support Near $0.073
Dogecoin is approaching the lower boundary of a long-term ascending trend channel, placing the $0.073 area in focus as a key macro support level.
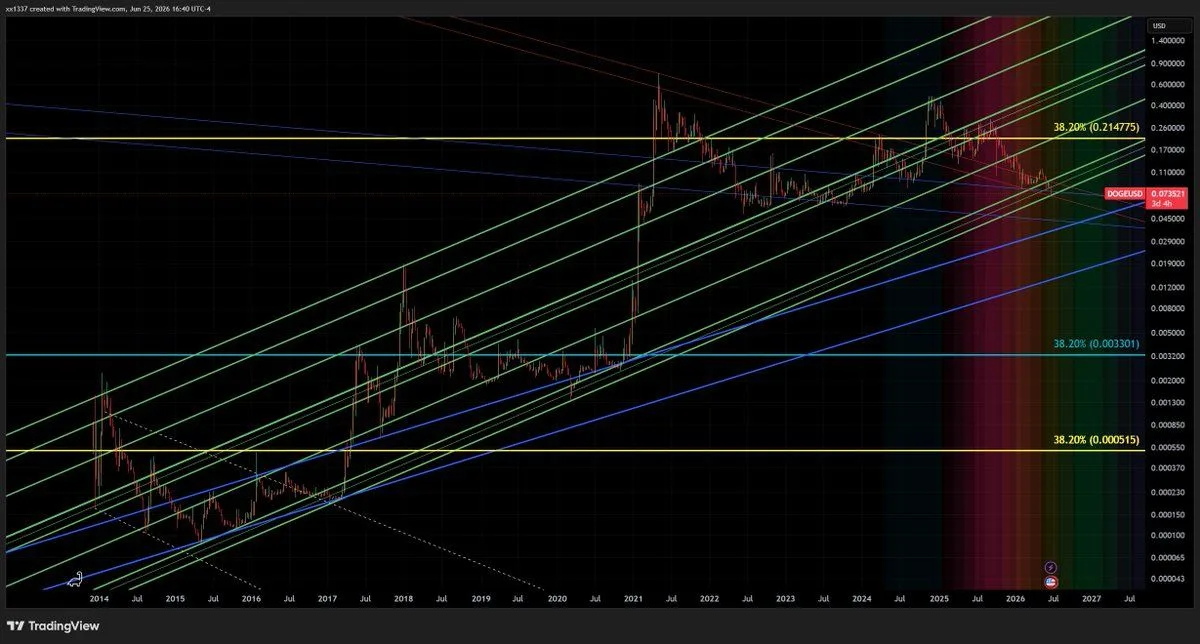
$DOGE/USD Macro Price Chart With Long-Term Trend Channels.
The chart shows $DOGE trading near $0.0735 after an extended decline from its 2025 highs. The current zone has previously acted as part of Dogecoin’s broader upward structure, raising the possibility of accumulation and a cycle low if buyers defend the trendline.
A recovery from this area could initially bring the $0.11 region into focus, followed by the 38.2% Fibonacci retracement level near $0.215. However, claims of 10x to 100x gains remain highly speculative and depend on Dogecoin maintaining its long-term trend and broader market conditions improving.
A decisive break below the lower trend boundary would weaken the macro bullish structure and could expose $DOGE to deeper losses. The $0.073 zone therefore represents what the analyst describes as the market’s last major line of defense.


