
Gold Trading Reminder: September Rate Hike Expectations Heat Up, Gold Prices See Four Consecutive Weekly Declines—Is It Time for Bulls to Buy the Dip?

Huitong Net, June 29 — Gold prices have fallen for the fourth consecutive week, plunging about 29% from the January high. A stronger dollar and rising Fed rate hike expectations are the main pressures. Geopolitical tensions have failed to boost safe-haven demand, and have instead reinforced tightening expectations by pushing up oil prices. Although there was a slight rebound on Friday, institutions remain generally bearish on the short-term trend. This week’s nonfarm payrolls numbers and US-Iran negotiations will be key variables.
Spot gold barely rebounded by 1.35% last Friday (June 26), closing at $4,081.02/oz. However, this insignificant gain cannot conceal a harsh reality—gold prices have now fallen for a fourth consecutive week. Since hitting a record high of $5,596 on January 29, gold has tumbled by about 29%. Once the favored safe-haven king, gold is now experiencing its longest weekly downtrend since 2023. Meanwhile, war clouds are gathering over the Strait of Hormuz, with US and Iranian forces clashing again over the weekend. When safe-haven assets are no longer safe, and gold prices remain sluggish amid the sounds of cannon fire, what market logic truly lies behind this gold collapse? This article will deeply analyze the truth and future trend of gold’s four-week slide from three dimensions: dollar hegemony, the Fed’s policy shift, and geopolitical changes.
In early Asian trading on Monday (June 29), spot gold is fluctuating in a narrow range, currently trading near $4,060/oz.
1. The Hammer of Dollar Hegemony: The Primary Driver of Gold’s Decline
Gold is priced in dollars, so the strength of the dollar directly determines the pricing benchmark for gold. Over the past week, the US Dollar Index hit a 13-month high above 101.8, posting its second consecutive weekly gain. A strong dollar acts like a heavy hammer, persistently pressuring gold prices downward.
The core driver of this dollar rally is the market's aggressive pricing in of a shift in Federal Reserve policy. The first policy statement from the new Fed chair was widely interpreted as “hawkish.” Market expectations for a rate hike shifted forward to as early as September, and the dollar embarked on a rally. Some analysts point out that this is not only due to the new chair and some fresh data, but also because the dollar market has been in a bull run since January; a slight pullback at present is not surprising.
The dollar’s strength is also reflected in a crucial change—the “decoupling” of gold from geopolitical risk. In the past, when Middle East tensions escalated, safe-haven funds would flow into gold, driving up its price. Yet now, with each new conflict report from the Strait of Hormuz, the market’s first reaction has been to sell gold and switch to dollars. Some analysts bluntly say that the narrative for gold prices has changed: during previous US-Iran conflicts, gold rose and oil fell, showing a clear negative correlation, but now their price trends may converge, falling together. The dollar’s role as the ultimate safe haven was fully revealed in this round of gold sell-offs.
2. The Fed’s “Hawkish Claws”: The Shocking Reversal from Rate Cuts to Rate Hikes
If the stronger dollar is the last straw that broke gold, then the 180-degree turn in Fed policy expectations is the first domino to fall.
Just a few months ago, the market was fervently discussing when the Fed would start cutting rates. However, the inflationary shockwave caused by the US-Iran war changed everything. The latest data shows US personal consumption expenditure (PCE) price index for May surged 4.1% year-over-year, with core PCE at 3.4%—both near multi-year highs. Inflation has not cooled; if anything, it is accelerating.
The Fed responded quickly and decisively. At the latest policy meeting, 9 out of 19 policymakers predicted at least one rate hike by year-end, while in March, not a single official made such a forecast. The market promptly priced this in—the probability of a rate hike in September climbed to 70% at one point, and even after the inflation data, remained around 59%.
What does this mean for gold? Gold is a non-yielding asset; when bond yields and real rates rise, the opportunity cost of holding gold soars. Some institutions warn that surging oil prices have pushed up inflation expectations, forcing the market to price in even tighter monetary policy, further raising the opportunity cost for gold. Other analysts state that the rapid hawkish repricing by the Fed has created strong bullish momentum for the dollar, leading to a sharp gold downturn, and see this correction potentially extending to $3,400 in the long run. Other institutions predict gold could fall to $3,500 by the end of 2026. Institutional investors are voting with their feet—gold ETFs saw net weekly outflows of over 15 tons, and several banks have already suspended related precious metals trading.
3. The Ghost of Hormuz: Why Geopolitics Can’t Save Gold
The traditional narrative for gold is as a “safe-haven asset”—buy gold in troubled times. However, last week’s dramatic developments in the Strait of Hormuz exposed the fragility of this story.
In mid-June, the US and Iran announced a phased agreement and reopened the Strait of Hormuz. This news sent crude oil prices plunging, sharply reducing market concerns about a major escalation in the Middle East. Gold’s safe-haven premium evaporated, accelerating the price drop. Early this week, gold opened near $4,145, then consistently weakened under Fed hawkishness, falling below the $4,000 mark to a new seven-month low of $3,959.
However, the fragility of the ceasefire was soon apparent. On Thursday, a cargo ship was attacked in the Strait of Hormuz, forcing the suspension of international escort operations. In the early hours of Saturday, a Panama-flagged oil tanker was hit by an Iranian drone, prompting new US strikes on Iran. US officials issued stern warnings on social media, stating restraint may no longer be exercised and that ultimate measures would be taken if the situation escalates. Both sides accused each other of violating the interim peace agreement signed just two weeks prior.
Yet, despite such intense geopolitical tension, gold’s reaction was surprisingly muted. On Friday, gold rebounded by just 1.3%, ending the week down 1.79%. Why? Because the market has formed a new consensus: Geopolitical conflict pushes up oil prices → Oil boosts inflation → Inflation forces Fed rate hikes → Rate hikes lift the dollar and bond yields → Gold comes under pressure and falls. In this chain, geopolitical conflict not only fails to save gold but actively accelerates its decline.
4. Last Friday’s Rebound: Technical Repair or Trend Reversal?
Following four straight weeks of declines, last Friday’s rebound offered the bulls a brief respite. Spot gold rose 1.35% to $4,081.02 (UTC+8), while August gold futures settled up 1.2% at $4,096.30 (UTC+8).
This rebound was directly triggered by inflation data, which caused the dollar to retreat from recent highs. Inflation figures were not as bad as the market had feared, coupled with a roughly 4% drop in oil prices on Friday (UTC+8), softening expectations for a Fed rate hike and lowering the probability of a September hike from 64% to 59%. The latest consumer confidence index showed a rebound, but concerns about inflation remain.
The physical market also saw some positive signals. Following the price correction, buying increased and gold in India traded at a premium for the first time in six weeks. However, as the largest consumer, Asian demand remains weak.
But does this mean a trend reversal? Wall Street’s mainstream view is “no”. In various surveys, only a minority of analysts expect gold to rise next week; most are bearish or expect consolidation. Some institutions predict the downtrend will persist for weeks ahead. However, some independent analysts believe the market has overreacted to the Fed’s hawkish tones in recent months, resulting in excessive gold selling. They argue gold is not in a long-term bear market, but remains in a long-term bull market.
5. Super Week Ahead: Nonfarm Payrolls Will Decide Fate
The coming week will be a key period in determining gold’s short-term fate.
On Wednesday, Fed Chair Walsh, ECB President Lagarde, BOE Governor Bailey, and Bank of Canada Governor Macklem will speak at the ECB Forum—investors should pay close attention.
The June US nonfarm payrolls report will be released ahead of schedule on Thursday (since Friday is the US Independence Day holiday). Market expectations are for new job growth in line with last month’s reading. This report is significant. If the jobs data exceeds expectations, it will further cement market bets on a Fed rate hike; if it falls short, investors may delay their expectations for any rate increase. Meanwhile, the US and Iran have agreed to halt attacks on each other and will meet in Doha on Tuesday in an attempt to shore up a ceasefire agreement that’s already showing cracks just 11 days in. Iran is intensifying its control over the Strait of Hormuz, requiring all transit ships to coordinate with the Revolutionary Guard, adding uncertainty to shipping time and insurance premiums. Investors should closely monitor developments and changing market expectations.
Major investment banks have cut their year-end 2026 gold price targets sharply. Nonetheless, amid the universally bearish sentiments, some institutions stick to their bull case, believing the Fed will take no action on rates this year. Some domestic brokers argue that if geopolitical tensions ease, and oil and inflation decline in the second half, increased expectations for marginal easing in Fed monetary policy could drive a new gold rally.
Conclusion
The four-week decline in gold is a perfect storm of multiple headwinds—dollar strength, rising Fed rate hike expectations, vanishing geopolitical premium, and sustained ETF outflows. Since January’s peak, the 29% drop has left many latecomer investors deeply stuck.
However, the pendulum of history never swings in only one direction. Some seasoned market participants provide a calm historical perspective: During the long bull market of the 1970s, gold fell about 45% from its mid-decade peak to the 1976 low, but then soared to record levels in 1980. During the early stages of the 2008 Great Recession, gold also plunged 30%. These historic episodes suggest a pattern: sharp corrections are often part of the journey in a long-term gold bull market.
Structural drivers that pushed gold to new highs—central bank gold buying, geopolitical risks, high global debt levels, and de-dollarization—have not disappeared. Last year, global central banks net bought over 860 tonnes of gold, which has surpassed US treasuries as the world's top reserve asset.
In the short term, gold still faces multiple pressures. Nonfarm payrolls, US-Iran talks, and Fed officials’ speeches—each variable could trigger another round of volatility. But as some strategists point out, as countries pump out more oil and revenues cycle back into the market, these funds will not necessarily all flow into US Treasuries—some may return to the gold market. The repeated contest at the $4,000 level may just be a sharp correction in this long bull market. For those with a longer horizon, the current “golden pit” might be a rare window for long-term positioning.
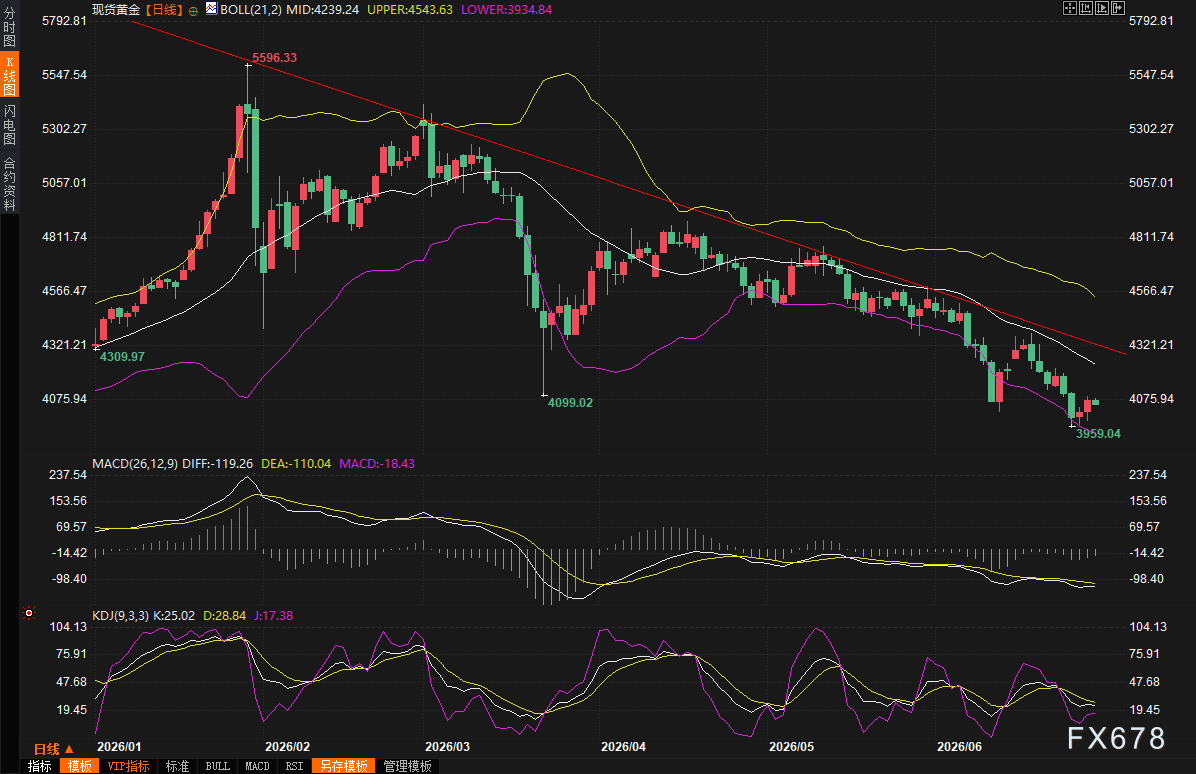
(Spot gold daily chart, source: EasyHuitong)
East 8th Zone, 07:25, spot gold is now quoted at $4,057.34/oz.
Disclaimer: The content of this article solely reflects the author's opinion and does not represent the platform in any capacity. This article is not intended to serve as a reference for making investment decisions.
You may also like
As global tungsten prices surge, U.S. mining company Almonty Industries (ALM.US) quickly acquires a tungsten mine in Rwanda to ease supply shortages.
U.S. mining company Almonty Industries has signed a tungsten mining agreement in Rwanda, expanding Western supply.

Novo Nordisk (NVO.US) renamed to "Novo" for a fresh start—Can multi-line breakthroughs dispel the shadow over its stock price?
Danish pharmaceutical company Novo Nordisk (NVO.US) has launched a comprehensive rebranding centered around the shorter name "Novo." The company will use "Novo" in daily brand promotion, but its legal name will remain Novo Nordisk A/S.

High interest rates are not the "end" of US stocks? Is profitability the real key?
JPMorgan believes that profit growth is the key factor determining the resilience of U.S. stock valuations. Data since 1950 shows an "inverted U-shaped" relationship between the 10-year U.S. Treasury yield and S&P 500 valuations. Based on current profit levels, yields would need to reach about 5%-6% to significantly compress valuations. As long as profit growth remains above 15%, there is still room for valuations to be re-rated. If the yield curve steepens in a bear market, cyclical sectors such as energy and financials will benefit more; if it flattens, technology stocks will have a relative advantage.
Crypto prices
More


