
One Chart: Overview of Gold, Crude Oil, Forex, and Stock Index "Pivot Points + Long/Short Position Signals" on June 29, 2026

Huitong Finance, June 29—— Below is the latest in the "One Chart Series," providing an overview of gold, crude oil, forex, and stock indices with “pivot points + long/short position signals”, including chart interpretations and textual analysis. By comparing the latest net long % with yesterday’s net long % (from the previous trading day), the analysis covers a total of 13 types of position signals, such as net long expansion, net long reduction, no change in net short, net short shifting to balance, etc. Depending on the actual data comparison, several of these signals are displayed accordingly.
One Chart: Overview of “Pivot Points + Long/Short Position Signals” for gold, crude oil, forex, and stock indices as of June 29, 2026. According to the latest data released today (Monday, June 29, 2026), as of just now, this chart shows that 5 varieties are currently in an “overbought” state (long above 80%), and 2 varieties are currently in an “oversold” state (long below 20%). Among them, the highest long position proportion is NZD/USD. Spot gold XAU/USD long position ratio: 81%. US crude oil WTI OIL long position ratio: 82%. EUR/USD long position ratio: 66%. For the change signals for these varieties compared with yesterday, and for the more detailed list, see the special chart by Huitong Finance.
Among the changes in positions: Net long expands for 5, net long decreases for 10, net short expands for 1, and net short decreases for 6. Varieties with a position of 80% and above include: spot gold XAU/USD, long proportion as high as 81%; US crude oil WTI OIL, long proportion as high as 82%; FTSE China A50, long proportion as high as 83%; S&P 500 index, long proportion as high as 80%; Nasdaq 100, long proportion as high as 80%. USD/JPY short position proportion as high as 93%. USD/CAD short proportion as high as 88%. AUD/USD long position proportion as high as 83%. NZD/USD long position proportion as high as 92%.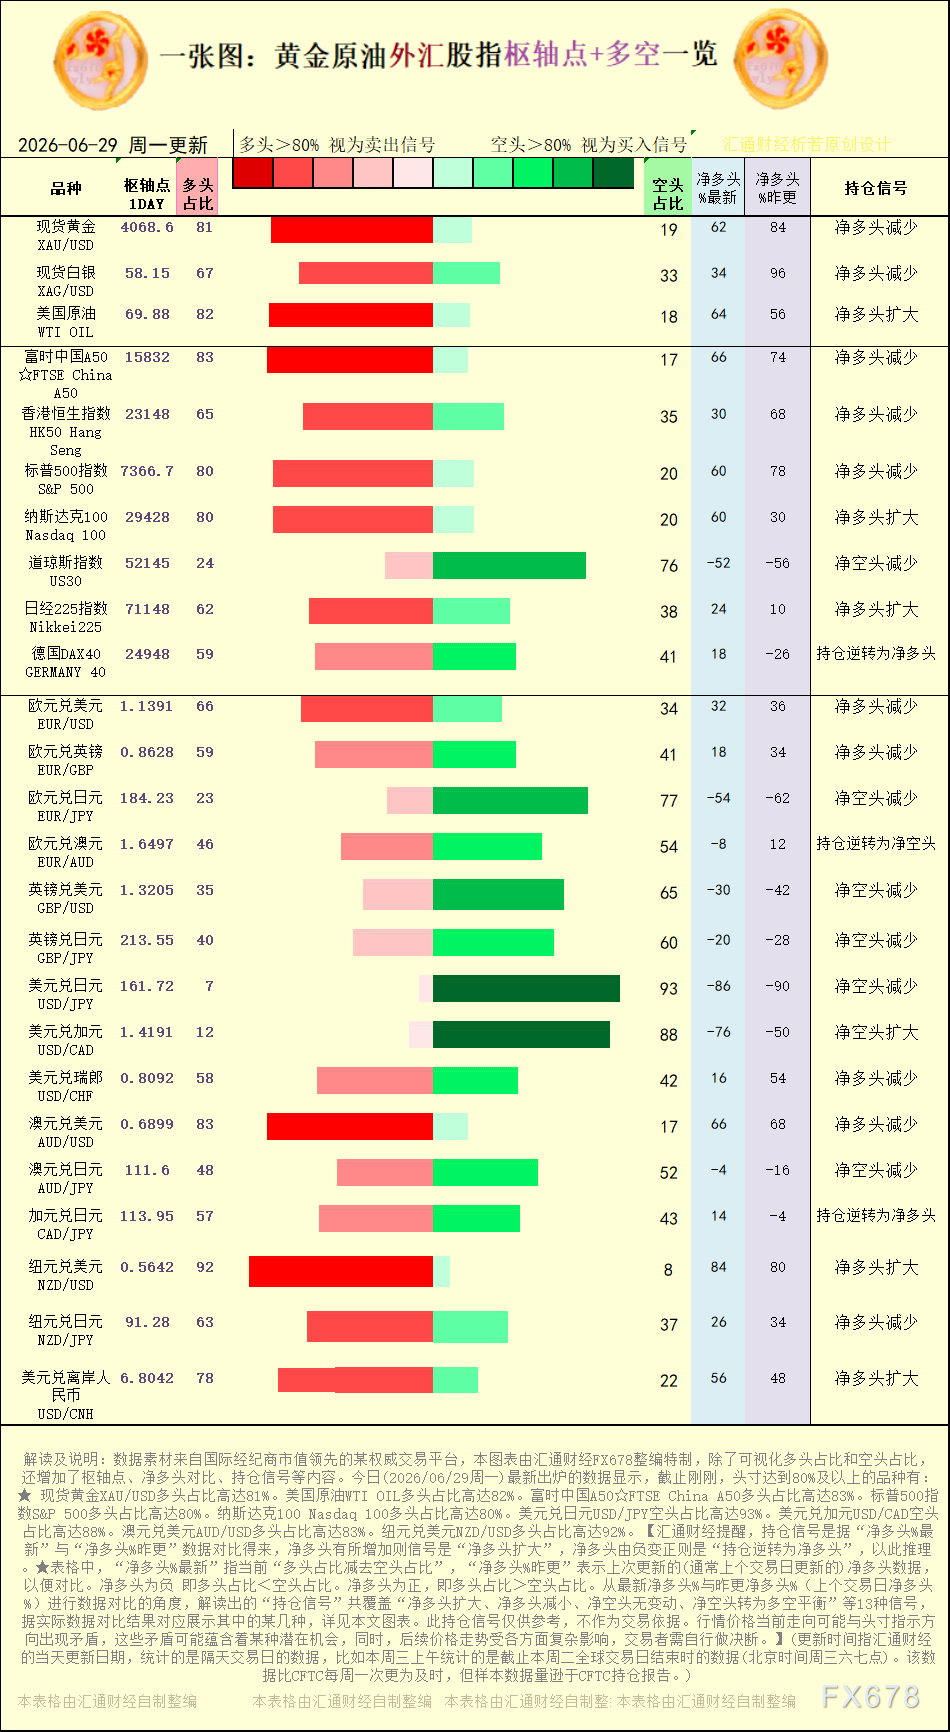
[Chart: Interpretation of pivot points and long/short position signals for gold, crude oil, forex and stock indices, source: Special chart by Huitong Finance. (Click on the image to enlarge)]
Net short decreases include: US30 Dow Jones index, EUR/JPY, GBP/USD, GBP/JPY, USD/JPY, AUD/JPY.
Net long expands for: US crude oil WTI OIL, Nasdaq 100, Nikkei225, NZD/USD, USD/CNH. Net long decreases for: spot gold XAU/USD, spot silver XAG/USD, FTSE China A50, HK50 Hang Seng Index, S&P 500 index, EUR/USD, EUR/GBP, USD/CHF, AUD/USD, NZD/JPY.
Huitong Finance reminds, position signals are derived by comparing the “latest net long %” with “net long % yesterday”; an increase in net long indicates a “net long expansion" signal, a change from negative to positive in net long indicates a "position reversal to net long", and so on. In the table, "latest net long %" refers to the difference between the current long proportion and the short proportion, "net long % yesterday" refers to the net long data from the last update (generally, from the previous trading day) for comparison. Negative net long means the long proportion is less than the short proportion. Positive net long means the long proportion exceeds the short proportion. By comparing the latest net long % with net long % yesterday (from the previous trading day), thirteen types of “position signals” such as net long expansion, net long reduction, no change in net short, net short shifting to balance, etc. are interpreted, and several of these types are displayed according to the actual data—see the chart. The current direction of price movements may contradict the direction indicated by positions; these conflicts may imply some potential opportunities. At the same time, future price movements are affected by numerous complex factors, and traders must make their own decisions.
[Trading varieties involved in this chart include: spot gold, spot silver, US crude oil, FTSE China A50, HK50 Hang Seng Index, S&P 500 index, Nasdaq 100, US30 Dow Jones index, DAX40 Germany, EUR/USD, EUR/GBP, EUR/JPY, EUR/AUD, GBP/USD, GBP/JPY, USD/JPY, USD/CAD, USD/CHF, AUD/USD, AUD/JPY, CAD/JPY, NZD/USD.]
Disclaimer: The content of this article solely reflects the author's opinion and does not represent the platform in any capacity. This article is not intended to serve as a reference for making investment decisions.
You may also like
Property Insurance MGU Unicorn Bamboo Insurance (BMB.US) IPO Priced at $18-20 per Share, Valuation Up to $3.13 Billion
Bamboo Insurance's first public offering (IPO) in the US targets a maximum valuation of $3.13 billion. The selling shareholders plan to issue 35 million shares at a price of $18 to $20 per share, aiming to raise up to $700 million.

Stocks Fall Pre-Bell Amid AI Safety Warnings; Investors Await Fed Rate Decision
As global tungsten prices surge, U.S. mining company Almonty Industries (ALM.US) quickly acquires a tungsten mine in Rwanda to ease supply shortages.
U.S. mining company Almonty Industries has signed a tungsten mining agreement in Rwanda, expanding Western supply.

Crypto prices
More


