
A Chart of Commodity Support and Resistance: Gold, Silver, Oil, Gas + Platinum, Palladium, Copper, Agricultural Futures (June 30, 2026)

FX678 June 30—— A single chart visualizing commodity support and resistance: gold, silver, oil, gas, platinum, palladium, copper, and agricultural futures, updated on Tuesday, June 30, 2026, 07:00 (UTC+8). Specifically covering 14 varieties including gold, silver, platinum, palladium, copper, crude oil, natural gas, fuel oil, wheat, corn, and cotton. For more details, refer to the FX678's custom chart.
A chart visualizing commodity support and resistance: gold, silver, oil, gas, platinum, palladium, copper, and agricultural futures, updated on Tuesday, June 30, 2026, 07:00 (UTC+8). Specifically covering 14 varieties including gold, silver, platinum, palladium, copper, crude oil, natural gas, fuel oil, wheat, corn, and cotton. For more details, see the content in the specially-made FX678 chart.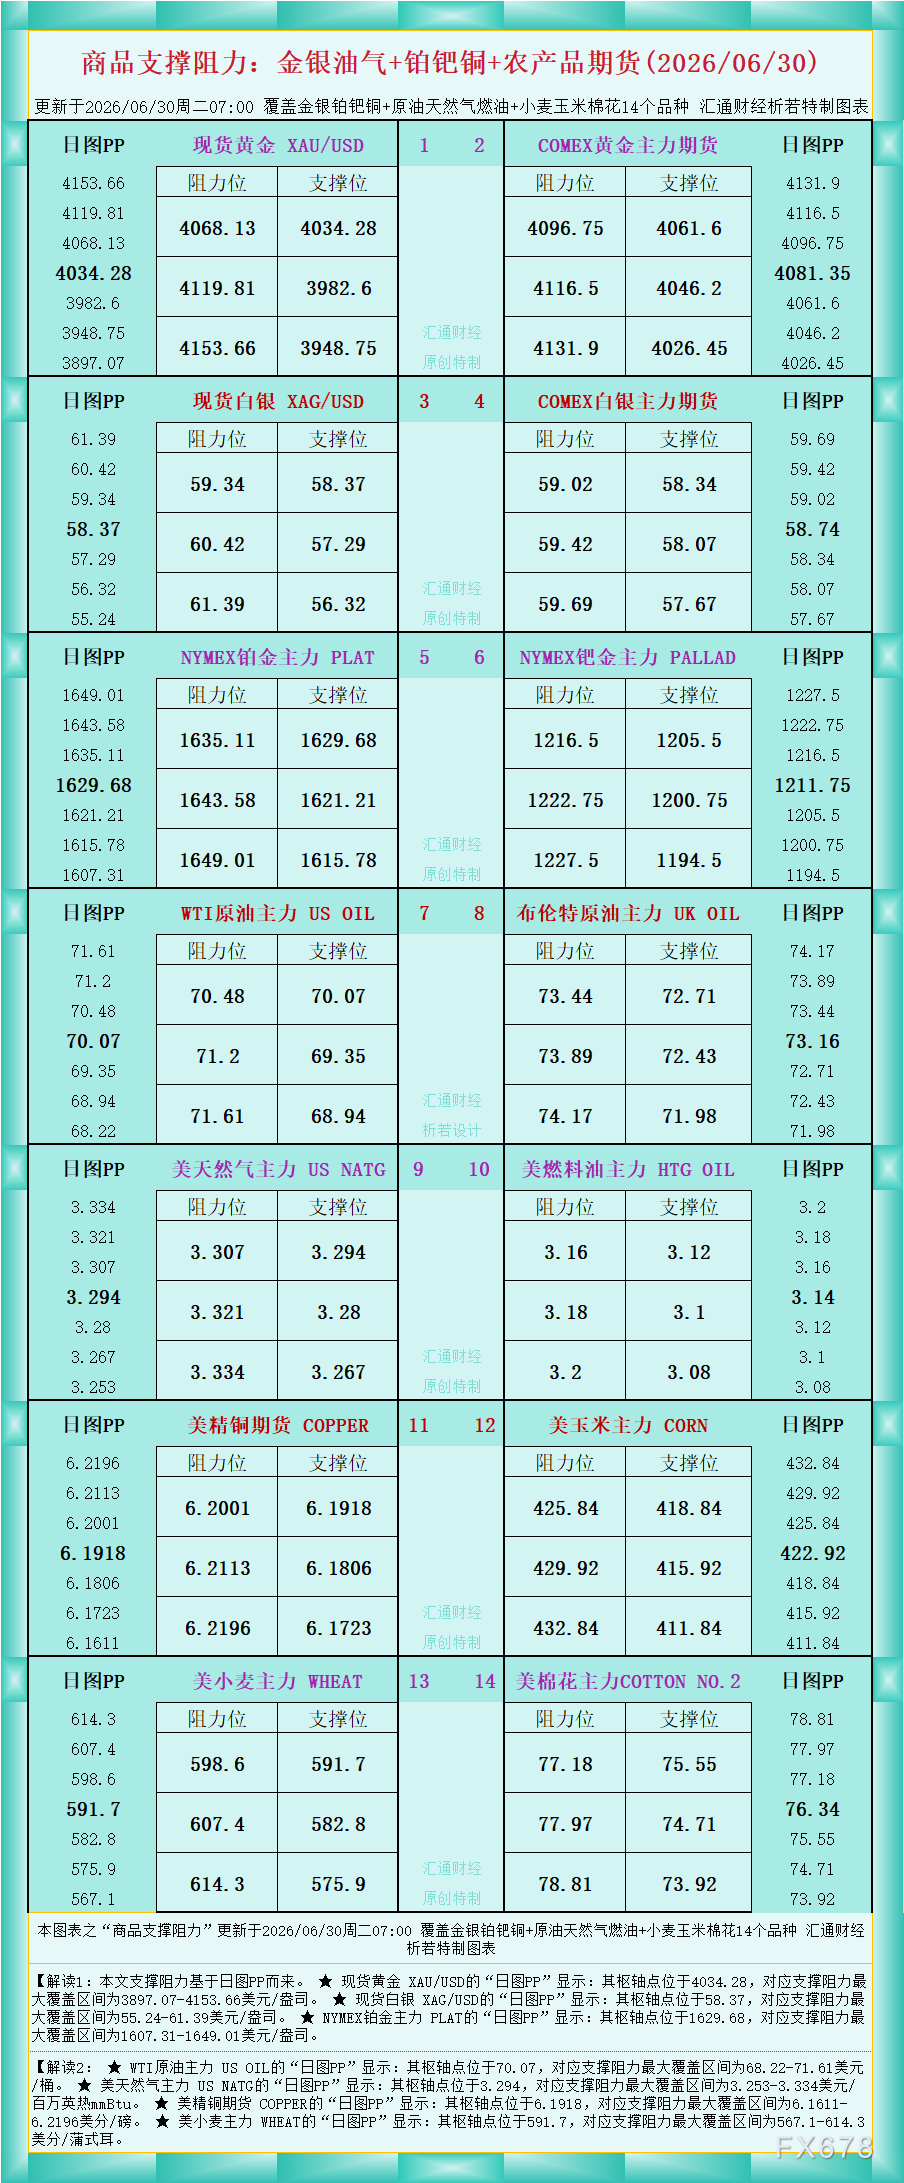
As shown in the figure, Interpretation 1: The support and resistance levels in this article are based on the daily chart pivot points (PP).
★ For spot gold XAU/USD, the “Daily Chart PP” shows: the pivot point is at 4034.28, with the maximum support and resistance range covering $3897.07-$4153.66/oz.
★ For spot silver XAG/USD, the “Daily Chart PP” shows: the pivot point is at 58.37, with the maximum support and resistance range covering $55.24-$61.39/oz.
★ For NYMEX platinum main contract PLAT, the “Daily Chart PP” shows: the pivot point is at 1629.68, with the maximum support and resistance range covering $1607.31-$1649.01/oz.
Interpretation 2:
★ For WTI Crude Oil main contract US OIL, the “Daily Chart PP” shows: the pivot point is at 70.07, with the maximum support and resistance range covering $68.22-$71.61/barrel.
★ For US natural gas main contract US NATG, the “Daily Chart PP” shows: the pivot point is at 3.294, with the maximum support and resistance range covering $3.253-$3.334/MMBtu.
★ For US copper futures COPPER, the “Daily Chart PP” shows: the pivot point is at 6.1918, with the maximum support and resistance range covering 6.1611-6.2196 cents/pound.
★ For US wheat main contract WHEAT, the “Daily Chart PP” shows: the pivot point is at 591.7, with the maximum support and resistance range covering 567.1-614.3 cents/bushel.
For more variety interpretations, refer to the chart. Produced originally and exclusively by FX678. All rights reserved.
Disclaimer: The content of this article solely reflects the author's opinion and does not represent the platform in any capacity. This article is not intended to serve as a reference for making investment decisions.
You may also like
The more impressive AI capabilities become, the more NAND storage needs to be expanded! Goldman Sachs analyzes SanDisk (SNDK.US) "Long-term Agreement + Massive AI Inference" Bull Market Logic
Goldman Sachs maintains a "Buy" rating for SanDisk and a 12-month target price of $2,200. Compared to the closing price of $1,737.99 on September 8 cited in the report, the potential upside is approximately 26.6%.

Bitcoin Miners Rebalance as AI Returns Outpace Mining
Treasury yields hit 4.85% despite $6B buyback: Crypto faces fresh pressure ahead of FOMC

Wall Street is optimistic about Apple's (AAPL.US) new growth cycle! iPhone 18 price increase boosts ASP, foldable screens and AI expected to open up incremental opportunities
Goldman Sachs and JPMorgan released research reports stating that Apple's Fall 2026 event overall met expectations, and both maintained their bullish ratings on Apple.

Crypto prices
More


