
A Chart: Overview of "Pivot Points + Long/Short Position Signals" for Gold, Crude Oil, Forex, and Stock Indices on July 1, 2026

Huitong Finance, July 1—— Below is the latest edition in the chart series showing “Pivot Points + Long/Short Positioning Signals” for gold, oil, forex, and indices, including both chart and text interpretation. By comparing the latest net long % with yesterday’s net long % (i.e., the previous trading day’s net long %), a total of 13 types of signals covering various long and short positioning are interpreted, including net long expansion, net long reduction, net short unchanged, net short turning to balanced, etc. The actual results of the data comparison will be matched with a few of these signals and displayed accordingly.
One Chart: Overview of “Pivot Points + Long/Short Positioning Signals” for gold, oil, forex, and indices on July 1, 2026. According to the latest data released today (Wednesday, July 1, 2026), currently, 4 instruments are in the “overbought” zone (long positions above 80%), and 4 in the “oversold” zone (long positions below 20%). Of these, NZD/USD has the highest long position proportion. Spot gold XAU/USD long positions: 0.92%. US crude oil WTI OIL long positions: 85%. EUR/USD long positions: 53%. Changes in these instruments from yesterday and a more detailed list are included in the special chart by Huitong Finance.
Among position change signals, there are 6 instances of net long expansion, 5 of net long reduction, 3 of net short expansion, and 3 of net short reduction. Instruments with positions at or above 80% include: spot gold XAU/USD short positions at 99.08%, US crude oil WTI OIL long positions at 85%, S&P 500 Index long positions at 84%, EUR/JPY short positions at 93%, USD/JPY short positions at 93%, USD/CAD short positions at 84%, NZD/USD long positions at 93%.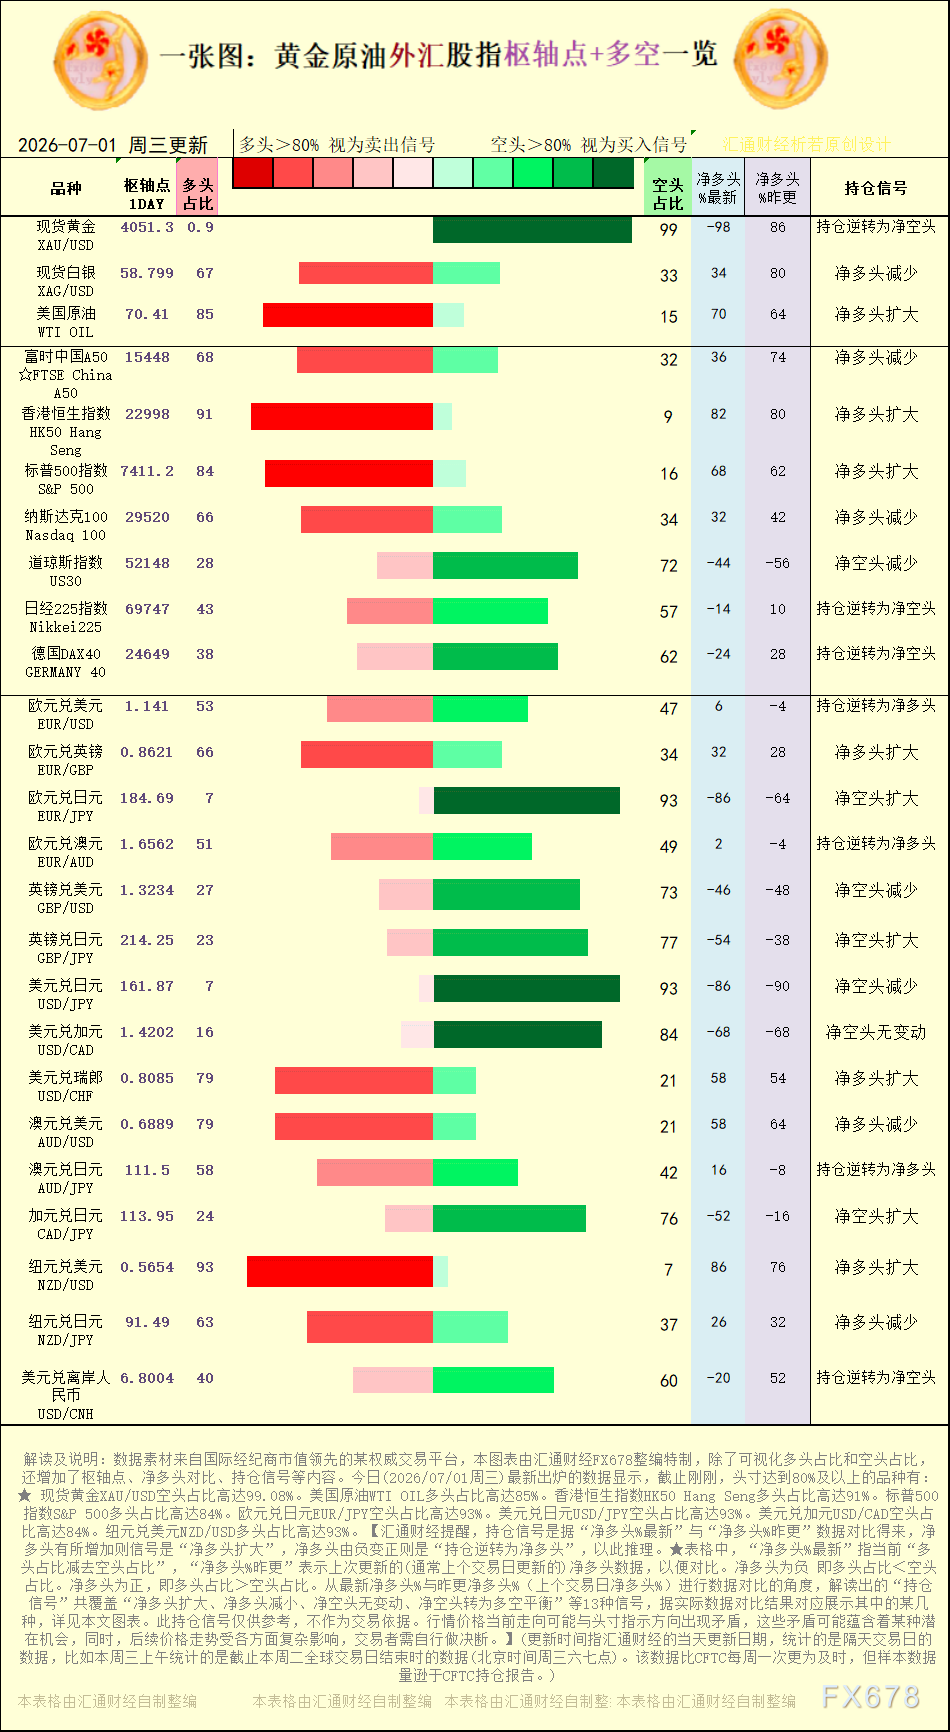
[Chart: Pivot points and long/short position signal interpretations for gold, oil, forex, and indices, source: Huitong Finance’s special chart. (Click image to enlarge)]
Cases where net short positions decreased: Dow Jones Index US30, GBP/USD, USD/JPY.
Cases of net long expansion: US crude oil WTI OIL, S&P 500 Index, EUR/GBP, USD/CHF, NZD/USD. Cases of net long reduction: spot silver XAG/USD, Nasdaq 100, AUD/USD, NZD/JPY.
Huitong Finance reminds readers that the position signals are based on the data comparison of “latest net long %” and “previous net long %”. If net long increases, the signal is “net long expansion”; if net long turns from negative to positive, it is “net long reversal”. In the table: “Latest net long %” refers to the current proportion of long positions minus the proportion of short positions; “Previous net long %” refers to the last updated net long data (usually from the previous trading day) for comparison. A negative net long means long positions short positions. From the perspective of data comparison between latest and previous net long %, the interpreted “positioning signals” cover a total of 13 types such as net long expansion, net long contraction, net short unchanged, net short shifting to balanced, etc. According to the actual results, a few are exhibited, details in the chart. Actual market price trends may sometimes contradict position direction signals, which may imply some potential opportunities. Meanwhile, future price trends are affected by a number of complex factors, and traders need to make independent decisions.
[Instruments covered in this chart include: spot gold, spot silver, US crude oil, S&P 500 Index, Nasdaq 100, Dow Jones Index, DAX 40, EUR/USD, EUR/GBP, EUR/JPY, EUR/AUD, GBP/USD, GBP/JPY, USD/JPY, USD/CAD, USD/CHF, AUD/USD, AUD/JPY, CAD/JPY, NZD/USD.]
Disclaimer: The content of this article solely reflects the author's opinion and does not represent the platform in any capacity. This article is not intended to serve as a reference for making investment decisions.
You may also like
The "Outlier" Investment Art in the New Era of Berky

Chevron (CVX.US) explores alternative hedging for Middle East supply disruptions: targets Argentina and the Mediterranean to drive global LNG growth, seeks deal with India
Chevron is focusing on Argentina and the Mediterranean region, seeking global growth in liquefied natural gas, and plans to reach an agreement with India.

Energy and food price pressures intensify, potentially triggering an inflation rebound! The Bank of England may struggle to remain "calm" as market rate hike bets surge
The upward pressure on energy prices caused by the unresolved Middle East war is mounting. New risks are also approaching, which may keep inflation above the Bank of England’s 2% target for most of next year.

AstraZeneca (AZN.US) Breast Cancer Drug Etcamah Faces Setback in Phase III Clinical Trial, Potentially Impacting Billions in Sales
Bloomberg Intelligence analyst John Murphy stated that the setback in AstraZeneca's breast cancer drug trial could reduce sales in 2035 by $2.6 billion to $3.8 billion.

Crypto prices
More


