u.today
Although Shiba Inu is still operating within a damaged market structure, the liquidity picture indicates that a relatively small amount of capital could potentially result in an outsized price reaction. The exchange reserve value of $SHIB is close to $374.3 million, and the exchange reserve is approximately 87.02 trillion tokens, according to the on-chain data provided.
Speculative cycles
In light of how aggressively $SHIB has moved during prior speculative cycles, this indicates that the liquid exchange-side supply, at least by this metric, is not very large. This is the source of the upside scenario of $350 million. $SHIB might see a significant reprice if that much concentrated demand entered the market while exchange liquidity remained scarce.
 $SHIB/USDT Chart by TradingView
Because order book depth, available float, and panic/FOMO behavior are more important than raw market capitalization in meme-asset markets, prices do not always move in proportion to capital inflow. Aggressive buying can drive up prices much more quickly than conventional valuation reasoning would suggest in a thin-liquidity environment. Technically speaking, though, $SHIB has not confirmed anything approaching a complete bullish reversal.
Shiba Inu loses momentum rapidly
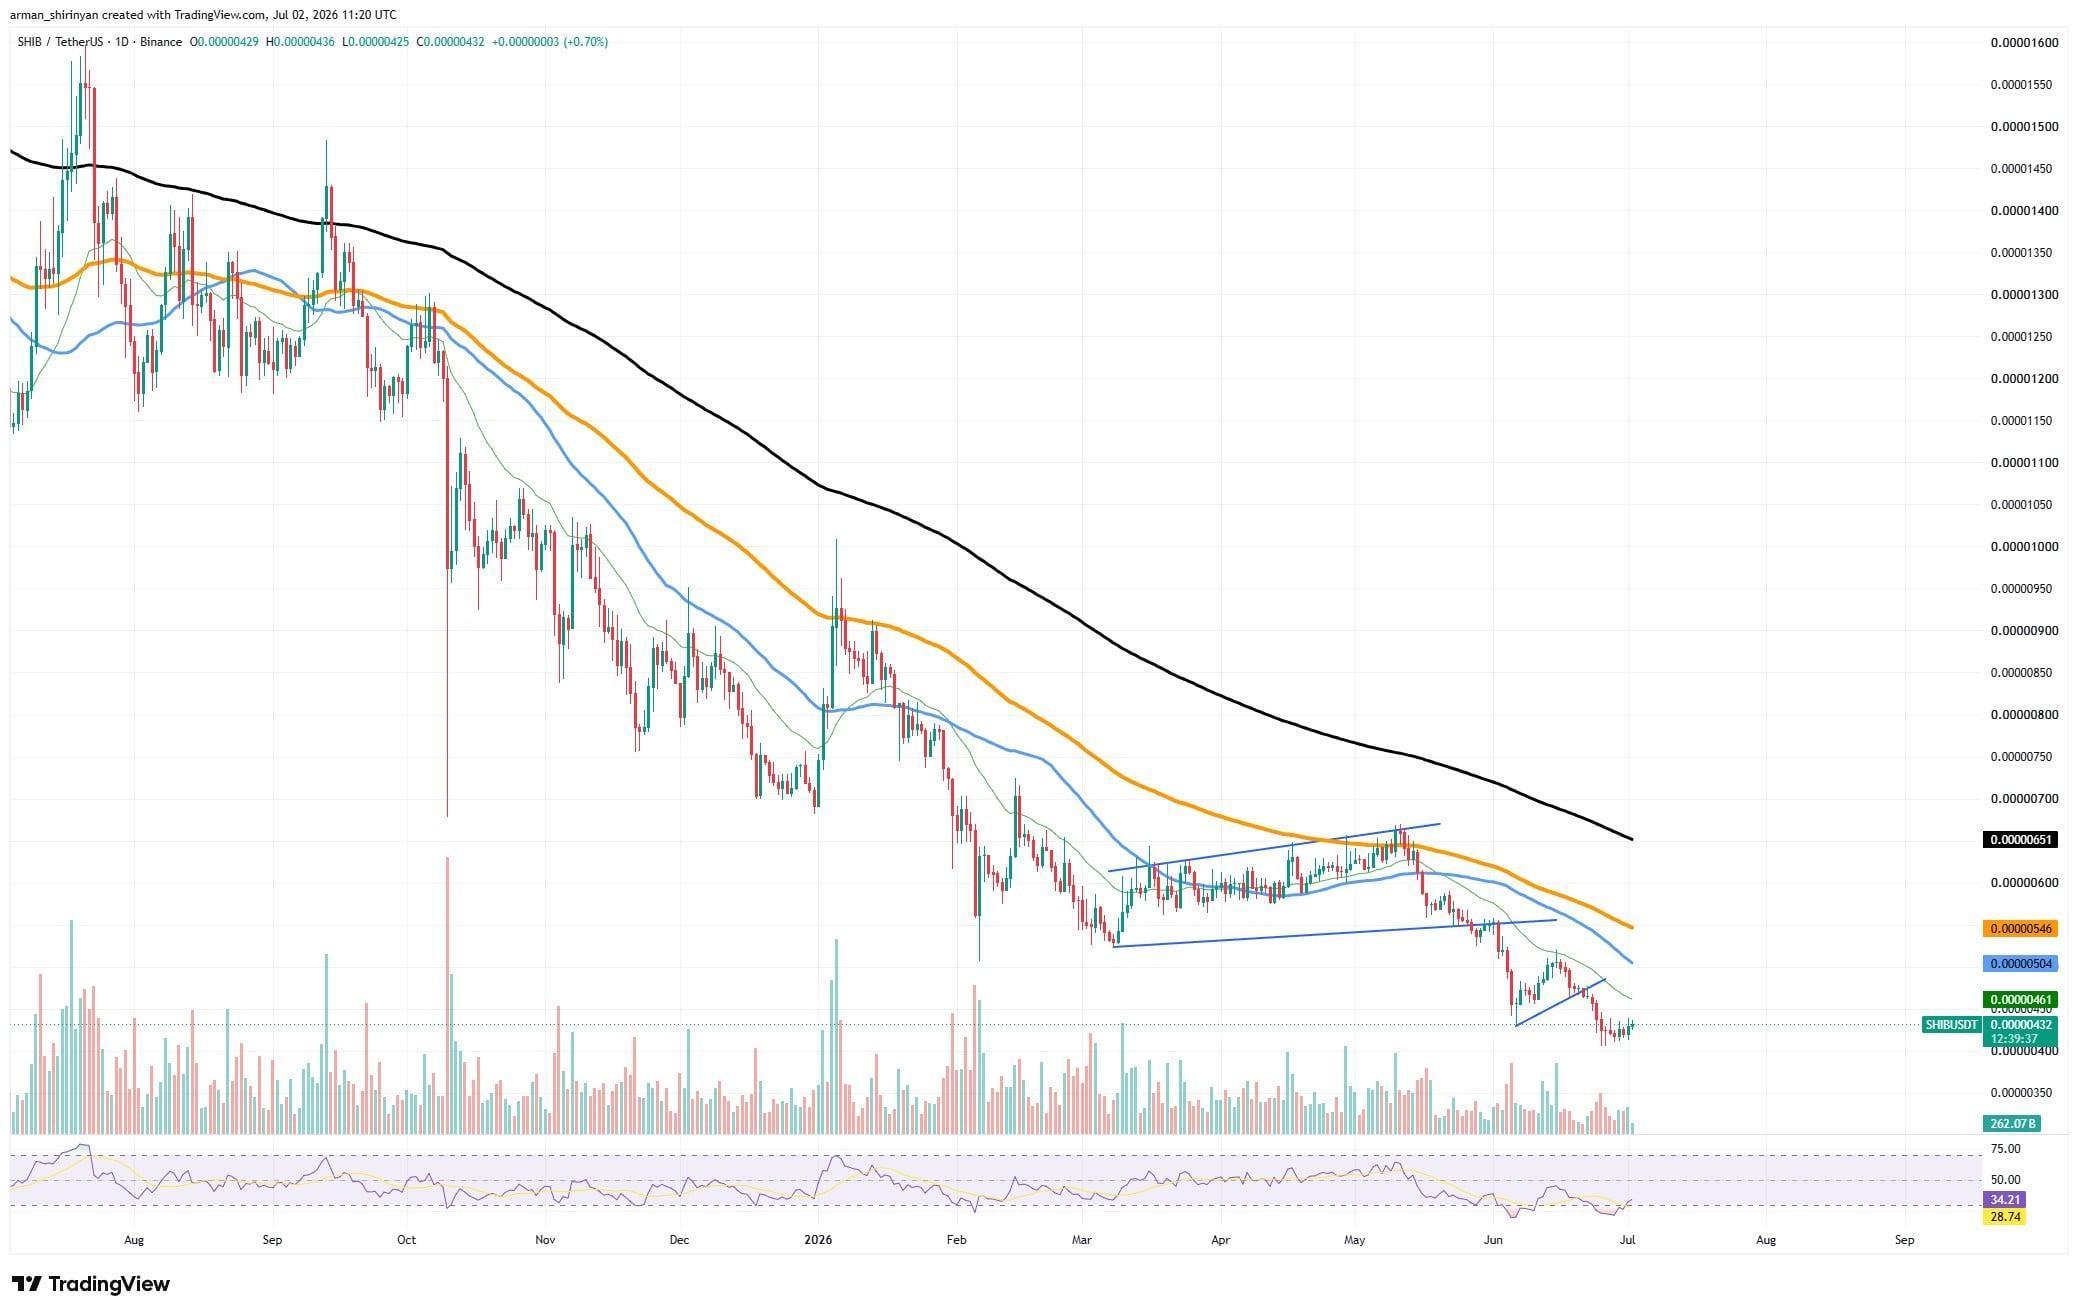
The token is trading close to $0.00000433 on the daily chart, which is still below the main moving averages. The larger trend is still downward, and the 50-, 100-, and 200-day averages are all still above the price. Around $0.00000505-$0.00000546, where $SHIB previously lost momentum, is the most significant resistance zone. The first real indication that bulls are taking back control would be a breakout above that region.
Near the black long-term moving average, at $0.00000651, is the larger resistance. Any rally is susceptible to rejection until $SHIB regains that level. After the June sell-off, the asset recently formed a small recovery structure, but the volume does not yet indicate a significant accumulation wave, and the bounce is still weak. On-chain activity is mixed. Both the total exchange inflow and outflow have increased by 0.41% and 0.26%, respectively.
At -0.46%, netflow is slightly negative, indicating that outflows are slightly ahead of inflows but not by enough to be considered a clear accumulation signal. Transaction counts have increased by 0.5% and active addresses by 0.61%, indicating a slight improvement in network activity rather than a spike in demand.