Solana is sitting at a key technical zone as two charts point to a possible reversal setup. One shows a Wyckoff-style accumulation pattern, while the other says a clean reclaim could open the path toward $233.8 and possibly $456 later.
Solana Chart Signals Possible Wyckoff Accumulation Setup
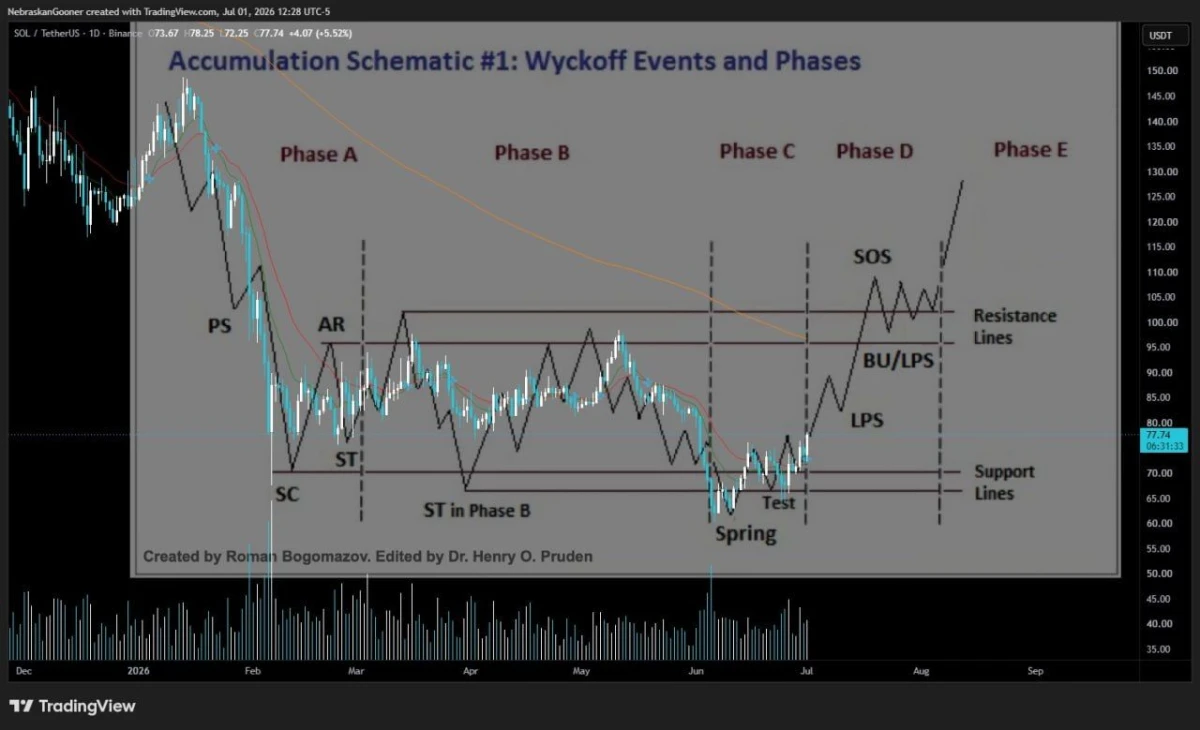
Solana may be forming a Wyckoff accumulation structure on the daily chart, with price now trying to recover after a spring-style move below support.
The chart compares $SOL’s recent price action with a classic Wyckoff accumulation schematic. It shows a long sideways range after a sharp selloff, followed by a breakdown below support and a quick recovery attempt.
$SOL/USDT daily chart. Source: Nebraskangooner on X, TradingView.
That breakdown is important because, in Wyckoff theory, a “spring” happens when price briefly moves below support to trap sellers before buyers step back in. The chart marks that area near the lower support range around $65 to $70.
$SOL is now attempting to move away from that spring zone. If buyers continue to defend support, the next key area to watch is the range resistance near $95 to $105. A clean move above that zone would strengthen the accumulation case.
The setup is not confirmed yet. $SOL still needs to reclaim the upper part of the range and show stronger follow-through before traders can call it a breakout.
The risk is a failed recovery. If $SOL falls back below the support zone and cannot reclaim it, the Wyckoff setup becomes weaker and the chart may need more time to build a base.
For now, the chart points to a possible accumulation phase. Bulls need to hold support and push $SOL back toward range resistance to keep the reversal setup alive.
Solana Chart Shows Key Reclaim Zone With $233 Target in Focus
Solana is pushing toward a key reclaim level that has acted as support multiple times in past market cycles, according to one analyst who says a successful move back above it could open the way for a much larger advance.
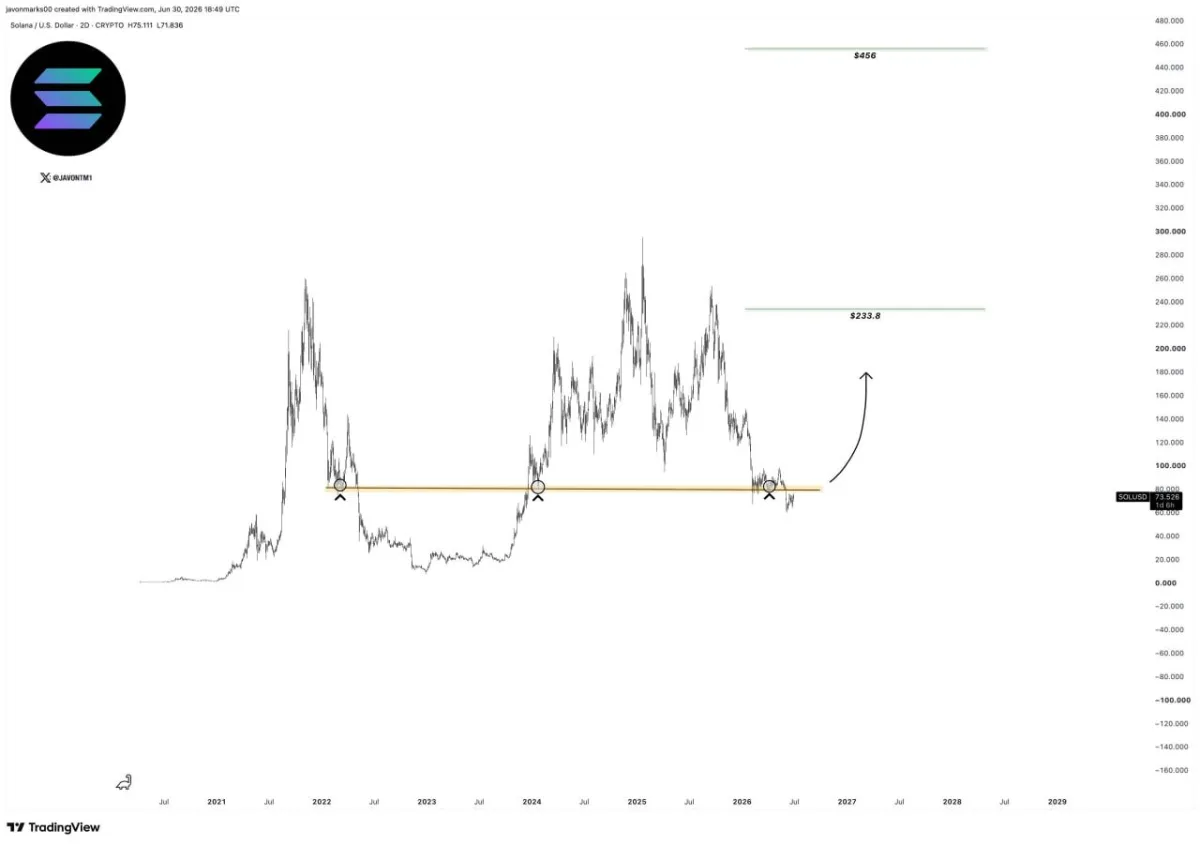
The two-day chart shows $SOL returning to a horizontal support area near the $75 to $80 range. That same zone helped define important turning points in 2022, 2024 and again in 2026, making it a key technical level to watch.
$SOL/USD two-day chart. Source: Javon Marks on X, TradingView
That matters because reclaiming former support after a breakdown can shift market structure back in favor of bulls. In this case, the chart suggests $SOL may be trying to build a base at a historically important area before attempting a stronger upside move.
Javon Marks said a clean reclaim could send Solana nearly 200% higher toward $233.8, which is marked as the next major technical target on the chart. If $SOL later breaks above that level, the chart points to a larger upside objective near $456.
For now, the setup is not confirmed. $SOL still needs to reclaim the support zone clearly and hold above it before the higher targets become more credible.
The risk is a failed reclaim. If $SOL cannot hold the zone and slips back below it, the bullish case weakens and the market may need more time before a larger recovery can develop.
For now, the chart puts Solana at a key technical test. A successful reclaim of long-term support could shift attention back to $233.8, while a stronger breakout above that level would bring the higher $456 target into focus.