
A Chart Overview of Commodity Support and Resistance: Gold, Silver, Oil, Gas + Platinum, Palladium, Copper, Agricultural Futures (July 3, 2026)

Huitong Finance July 3 ——— An overview chart of commodity support and resistance: gold, silver, oil, gas + platinum, palladium, copper + agricultural futures, updated at 07:20 on Friday, July 3, 2026 (UTC+8), specifically covering 14 varieties including gold, silver, platinum, palladium, copper + crude oil, natural gas, fuel oil + wheat, corn, and cotton. For more details, refer to the special chart produced by Huitong Finance Analyzer.
An overview chart of commodity support and resistance: gold, silver, oil, gas + platinum, palladium, copper + agricultural futures, updated at 07:20 on Friday, July 3, 2026 (UTC+8), specifically covering 14 varieties including gold, silver, platinum, palladium, copper + crude oil, natural gas, fuel oil + wheat, corn, and cotton. For more details, refer to the special chart produced by Huitong Finance Analyzer.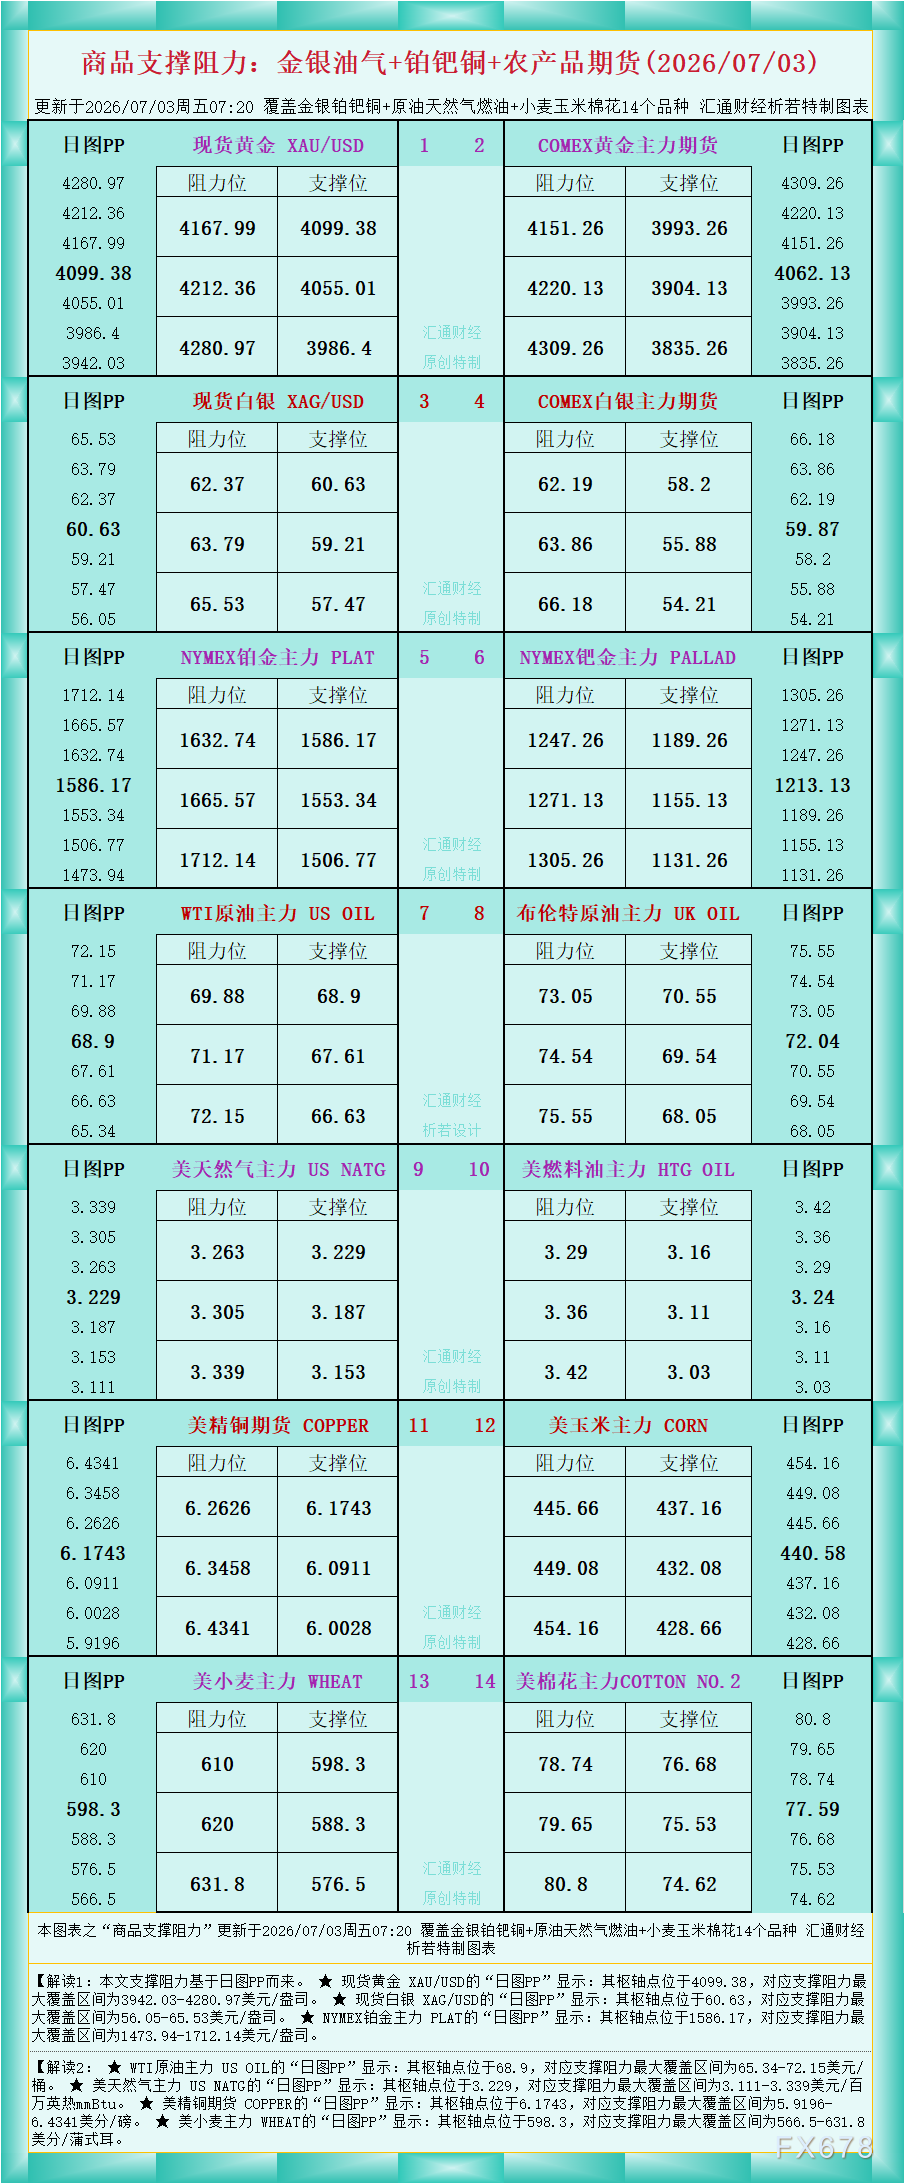
According to the chart data, Interpretation 1: The support and resistance levels in this article are based on daily chart PP.
★ The daily chart PP for spot gold XAU/USD shows: the pivot point is at 4099.38, with the maximum support and resistance range between $3942.03-$4280.97/oz.
★ The daily chart PP for spot silver XAG/USD shows: the pivot point is at 60.63, with the maximum support and resistance range between $56.05-$65.53/oz.
★ The daily chart PP for NYMEX platinum main contract PLAT shows: the pivot point is at 1586.17, with the maximum support and resistance range between $1473.94-$1712.14/oz.
Interpretation 2:
★ The daily chart PP for WTI crude oil main contract US OIL shows: the pivot point is at 68.9, with the maximum support and resistance range between $65.34-$72.15/barrel.
★ The daily chart PP for US natural gas main contract US NATG shows: the pivot point is at 3.229, with the maximum support and resistance range between $3.111-$3.339 per million British thermal units (mmBtu).
★ The daily chart PP for US copper futures COPPER shows: the pivot point is at 6.1743, with the maximum support and resistance range between 5.9196-6.4341 cents/pound.
★ The daily chart PP for US wheat main contract WHEAT shows: the pivot point is at 598.3, with the maximum support and resistance range between 566.5-631.8 cents/bushel.
For more product interpretations, see the chart.
Disclaimer: The content of this article solely reflects the author's opinion and does not represent the platform in any capacity. This article is not intended to serve as a reference for making investment decisions.
You may also like
Crypto: In 2026, BNB Chain Emerges as the Global Leader in RWA Growth

BlackRock Bitcoin ETF outflows hit $19.23M as sector sheds $463M in four days
Pi Network Price Prediction: Can PI Hold Its Wedge Breakout Before the Upgrade?
As AI controversies escalate, hedge funds buy tech stocks at the fastest pace in 15 months
Hedge funds have recorded net purchases of US TMT stocks on 10 out of the past 11 trading days, rebuilding tech long positions at the fastest pace in 15 months. However, an AI policy storm has struck at the "worst possible time"—calls by AI giants to slow down development have been rejected, and regulatory uncertainty has directly hit Asian tech stocks such as Softbank. As the tech sector's bullish run coincides with Super Central Bank Week, the sector now faces a severe test.
Crypto prices
More


