XRP trades at $1.1467 on July 4, up 1.13% and pressing directly against a descending trendline that has capped every rally since May, with the chart marking the current zone as a breakout that needs several hours above the line to confirm.
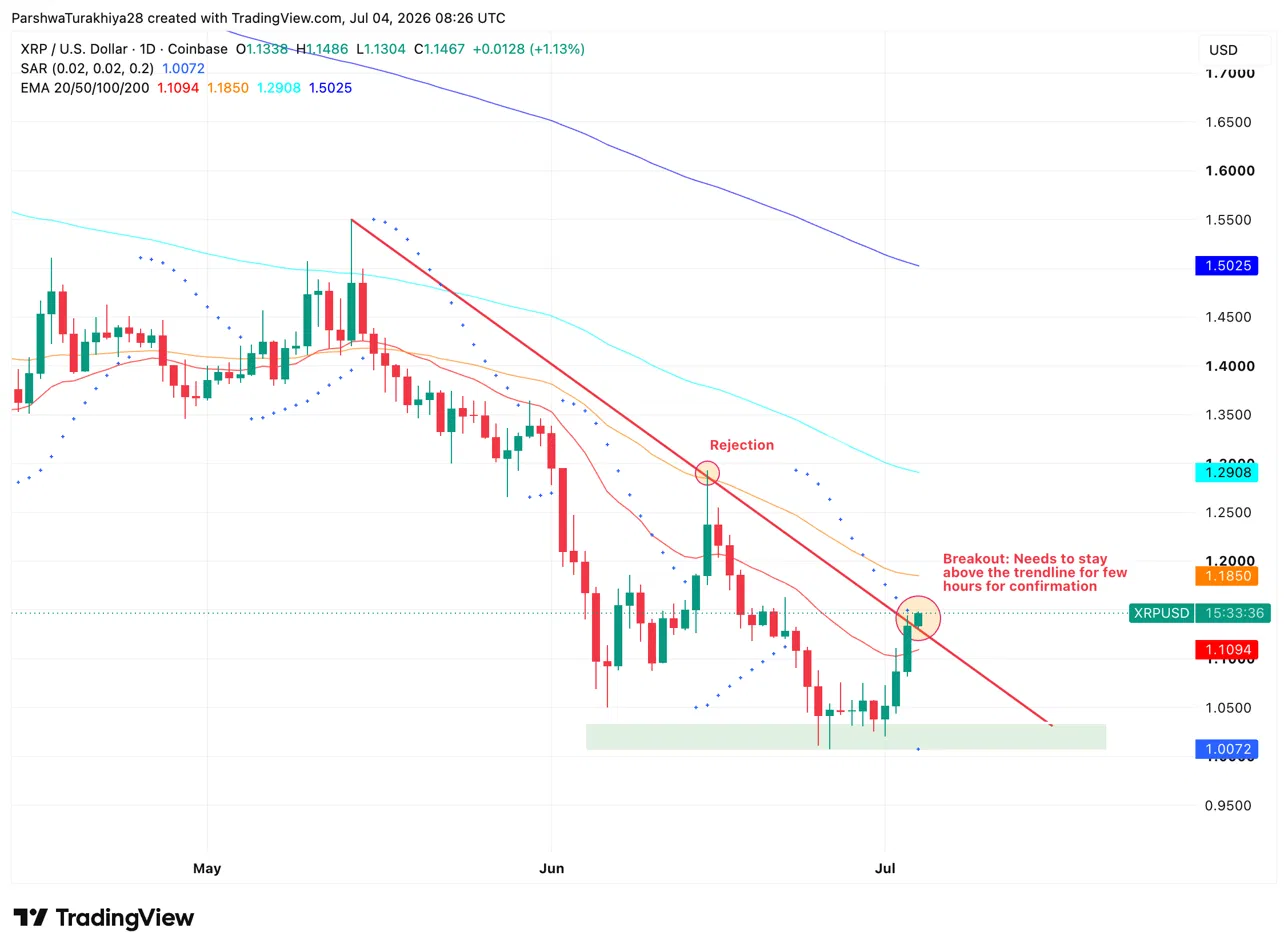
The daily chart shows XRP clearing above a steep descending trendline drawn from the May highs, with the annotation noting price needs to hold above the line for a few hours before the move can be called a confirmed breakout. A prior test of this same trendline in early June resulted in a clear rejection, so the market is watching this attempt carefully.
The Parabolic SAR at $1.0072 now sits comfortably below price following the bounce from the $1.00 floor, confirming short-term momentum has shifted. Every EMA remains above spot: the 20-day at $1.1094 is essentially at price, the 50-day at $1.1850 is the next target, the 100-day at $1.2908 and the 200-day at $1.5025 sit well above.
- Support at $1.1304 intraday low and the $1.0072 SAR floor
- Resistance at $1.1850 on the 50-day EMA, then $1.2908 on the 100-day
On-chain analytics firm Santiment reported that XRP’s 30-day MVRV ratio sits near -45% and its 365-day version near -47%, both at their lowest levels in the token’s history. MVRV measures how far the average holder is underwater relative to the price at which their coins last moved. When both short and long-term versions hit simultaneous lows of this depth, it typically marks a capitulation phase where weaker hands have already sold and remaining sellers are mostly exhausted.
Santiment frames it as a risk-reward signal rather than a price call, noting that stretches of maximum pain often precede better setups for buyers, while cautioning the gauge measures how washed out positioning is, not when a turn happens. XRP is up roughly 8% over the past seven days even as that reading stays depressed, which analysts note fits the absorption pattern seen near cycle lows.
US spot XRP ETFs recorded $6.55M in daily inflows on July 2, with only Bitwise’s fund reporting that day. The weekly total for the period ending July 2 came in at $17.19M, pushing the streak to nine consecutive weeks of net positive flows and cumulative inflows to $1.49B. Total net assets across all five funds reached $987.91M, approaching the $1B mark.
The weekly consistency matters more than any single day here. Nine straight positive weeks through a period where XRP price dropped from above $1.30 to $1.00 and back shows institutional buyers have been absorbing the decline rather than exiting into it.
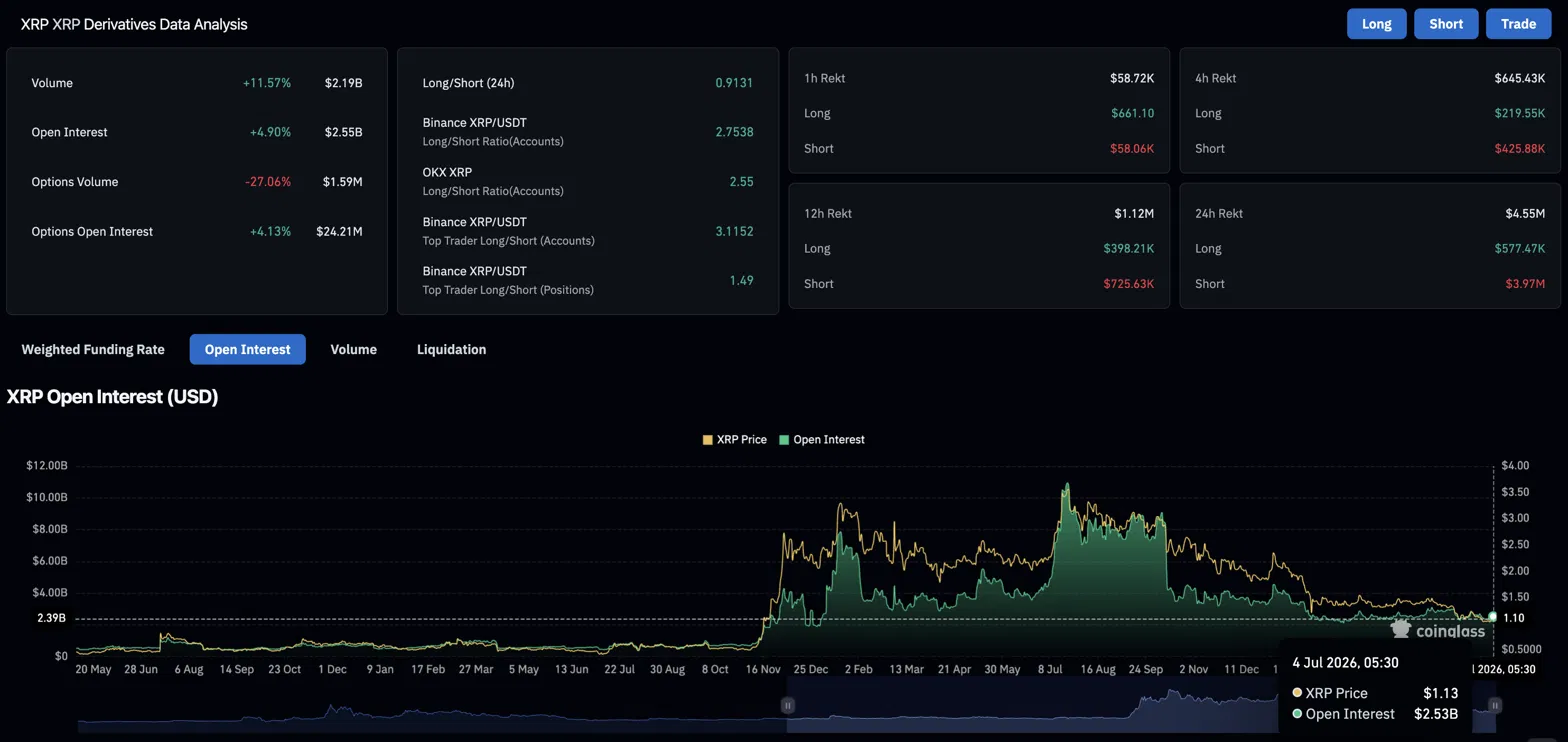
Derivatives volume rose 11.57% to $2.19B while open interest climbed 4.90% to $2.55B, both moving higher together, a sign new money is entering rather than old positions closing. The long/short ratio sits at 0.9131, meaning shorts still slightly outnumber longs across accounts, but the liquidation data shows those shorts are losing badly.
Over the past 24 hours, shorts lost $3.97M against just $577.47K for longs. The same pattern holds over shorter windows, with shorts giving up $725.63K versus $398.21K for longs over 12 hours and $425.88K against $219.55K over four hours. Bears are getting squeezed at every timeframe, and with the long/short ratio still tilted toward shorts, there’s more fuel for that squeeze to continue if the trendline breakout holds and forces remaining short positions to cover.
XRP Price Prediction: Upside and Downside Targets
- Upside case: The trendline breakout holds with a daily close above it, short covering accelerates, and XRP targets $1.1850 on its way toward $1.2908.
- Downside case: The trendline rejects price again as it did in June, XRP slips back below the 20-day EMA at $1.1094, and the $1.00 floor faces another test.