

Recent technical and on-chain data suggest that the selling pressure on Bitcoin may be easing. Analysts are noting that signals seen ahead of previous strong recoveries are now reappearing, increasing optimism among investors that a rebound could be on the horizon.
Analysts highlight rare bullish signals in Bitcoin, $65,400 target emerges
By:Cointurk
Bitget offers one-stop trading for cryptocurrencies, stocks, and gold. Trade now!
A welcome pack worth 6200 USDT for new users! Sign up now!
Noticeable changes in technical indicators
Bitcoin is currently trading at $62,502. Over the past 24 hours, its price has risen by 1.26%, with daily trading volume at $25.47 billion and a market capitalization standing at $1.25 trillion. The world’s largest cryptocurrency commands a market dominance of 57.99%.
Technical analyst Ali Martinez reports that three rarely-seen bullish signals have emerged simultaneously on Bitcoin’s 12-hour chart. Martinez believes these indicators are being closely watched by the market to gauge Bitcoin’s short-term direction.
Ali Martinez observes that three strong technical signals appearing at once on Bitcoin’s 12-hour chart point to a loss of momentum in the most recent selling wave.
The Tom DeMark Sequential (TD Sequential) indicator has generated a buy signal, while the Relative Strength Index, or RSI, is displaying a bullish divergence. This divergence suggests that although prices have continued to move down, underlying momentum is starting to build. Additionally, a reversal in the SuperTrend indicator toward a bullish direction further supports a potential short-term recovery.
Mini glossary: The TD Sequential is a technical indicator designed to identify potential turning points in the market. The SuperTrend indicator uses price and volatility data to track short-term trend changes.
Should these positive signals be confirmed by sustained buying in the spot market, analysts identify $65,400 as the next significant target. This level also coincides with a resistance line highlighted by the TD Sequential indicator.
On-chain data points to a potential bottom
On-chain metrics are painting a similar picture alongside technical analysis. Blockchain analytics firm CryptoQuant reports that the realized profit and loss ratio for Bitcoin has dropped to minus 0.35—its lowest level in the past 43 months.
CryptoQuant notes that, historically, a sharp decline in this indicator has typically occurred near long-term price bottoms, after which Bitcoin has staged recoveries. The company cautions, however, that while this is a notable historical signal, it should not be interpreted as a definitive confirmation of a market reversal.
Data from CryptoQuant shows that steep drops in the realized profit and loss ratio have previously appeared near long-term bottoming periods for Bitcoin.
The convergence of multiple technical indicators with historically important on-chain signals is bolstering expectations of a market rebound. Nonetheless, analysts warn that no single indicator offers absolute certainty regarding market direction.
If Bitcoin breaks above the nearby resistance with strong buying activity, the $65,400 level is likely to become a focal point in the market. Conversely, if current support fails to hold, the price may remain range-bound and any recovery could face further delays.
0
0
Disclaimer: The content of this article solely reflects the author's opinion and does not represent the platform in any capacity. This article is not intended to serve as a reference for making investment decisions.
Understand the market, then trade.
Bitget offers one-stop trading for cryptocurrencies, stocks, and gold.
Trade now!
You may also like
Crypto: In 2026, BNB Chain Emerges as the Global Leader in RWA Growth
Cointribune•2026/09/14 07:51

BlackRock Bitcoin ETF outflows hit $19.23M as sector sheds $463M in four days
Cryptonomist•2026/09/14 07:30
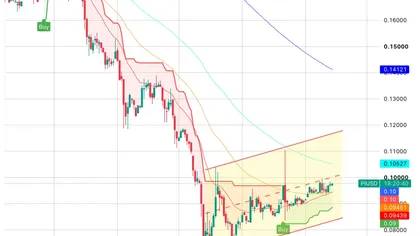
Pi Network Price Prediction: Can PI Hold Its Wedge Breakout Before the Upgrade?
Coinedition•2026/09/14 07:27
As AI controversies escalate, hedge funds buy tech stocks at the fastest pace in 15 months
Hedge funds have recorded net purchases of US TMT stocks on 10 out of the past 11 trading days, rebuilding tech long positions at the fastest pace in 15 months. However, an AI policy storm has struck at the "worst possible time"—calls by AI giants to slow down development have been rejected, and regulatory uncertainty has directly hit Asian tech stocks such as Softbank. As the tech sector's bullish run coincides with Super Central Bank Week, the sector now faces a severe test.
华尔街见闻•2026/09/14 07:03
Crypto prices
More
Bitcoin
BTC
$77,785.91
+1.01%

Ethereum
ETH
$2,523.31
+0.48%

Tether USDt
USDT
$0.9995
-0.01%

BNB
BNB
$724.49
+0.36%

XRP
XRP
$1.39
+2.57%

USDC
USDC
$0.9998
+0.00%

Solana
SOL
$101.5
+0.97%

TRON
TRX
$0.3392
-0.16%

Hyperliquid
HYPE
$79.78
+1.74%

Zcash
ZEC
$1,138.86
+1.03%
How to buy BTC
Bitget lists BTC – Buy or sell BTC quickly on Bitget!
Trade now
Become a trader now?A welcome pack worth 6200 USDT for new users!
Sign up now