
Bitget App
Trade smarter
Buy cryptoMarketsTradeFuturesStocksEarnInstitutionAI & More
Dogecoin Set for Weekly Death Cross After 3-Year Gap, Is History Repeating?

Dogecoin Set for Weekly Death Cross After 3-Year Gap, Is History Repeating?

CryptoNewsNetCryptoNewsNet2026/07/05 00:21
By:CryptoNewsNet
Back to the list

Dogecoin Set for Weekly Death Cross After 3-Year Gap, Is History Repeating?

Dogecoin Set for Weekly Death Cross After 3-Year Gap, Is History Repeating? image 0  u.today 8 m
Dogecoin Set for Weekly Death Cross After 3-Year Gap, Is History Repeating? image 1

A potential death cross setup seems to be taking shape on Dogecoin's weekly chart, with traders now paying close attention.

The weekly MA 50 (50 WMA) has pulled downwards and might meet the 200 WMA in the coming weeks. If the 50 WMA falls beneath the 200 WMA following the convergence, a death cross signal might be confirmed.
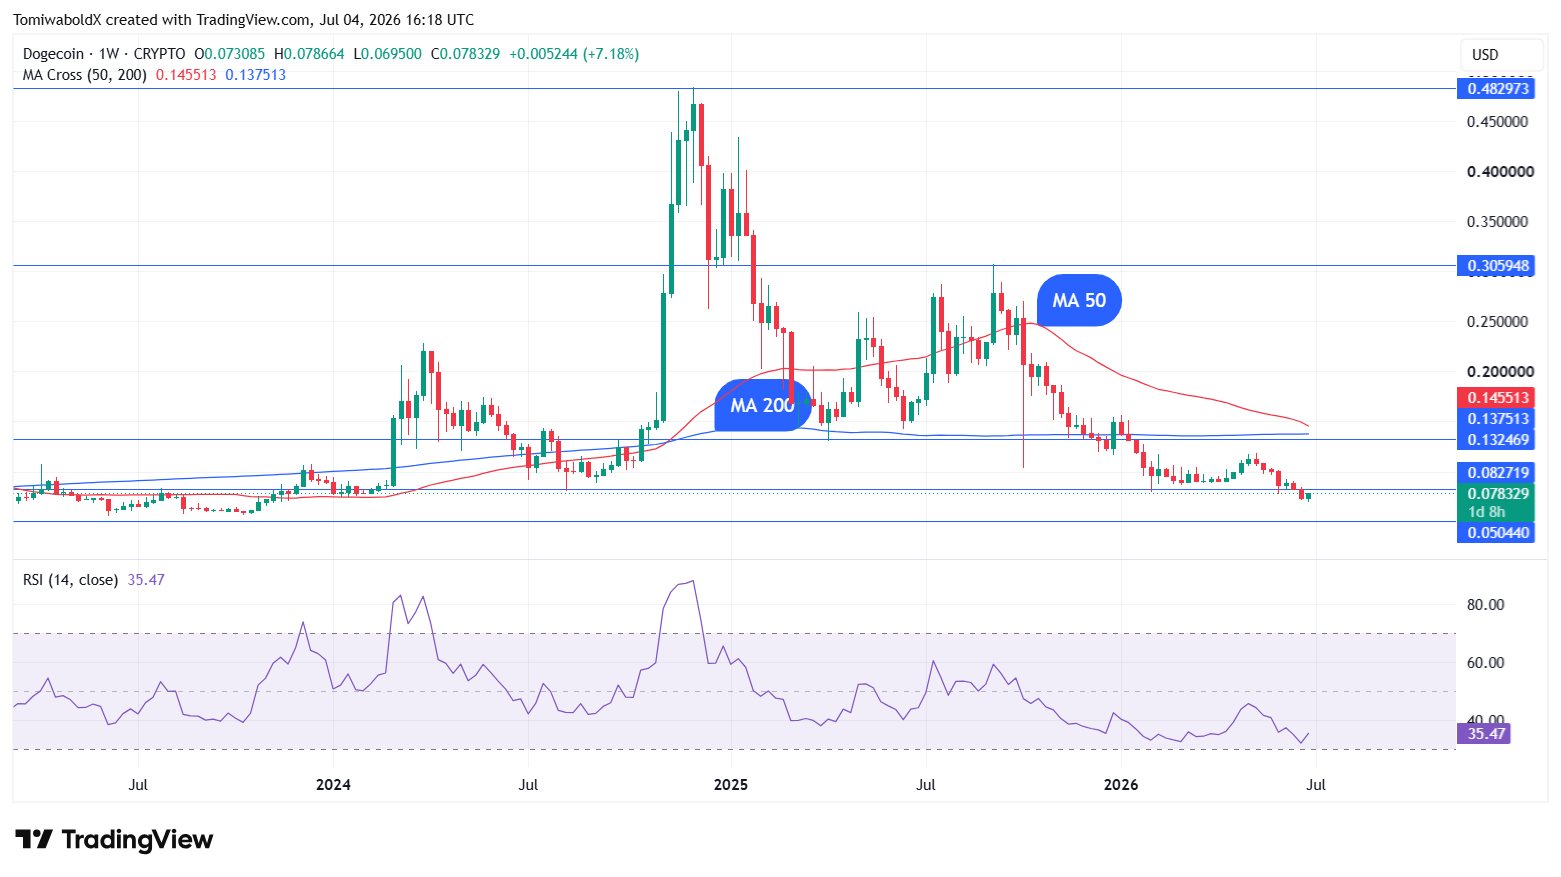
Dogecoin Set for Weekly Death Cross After 3-Year Gap, Is History Repeating? image 2 $DOGE/USD Weekly Chart, Image By TradingView

While golden and death cross signals are not new to Dogecoin, as a handful have appeared on short-term timeframes since its inception, the weekly chart remains an exception, having seen only three such crossovers since February 2021. Two of these three instances are golden cross signals, highlighting the rarity of a death cross on its weekly chart.

In particular, this rare bearish technical signal has not appeared on its weekly chart in more than three years. The last time Dogecoin saw a death cross on its weekly chart was in February 2023.

Will history repeat?

Dogecoin price action has often mirrored the nature of the crossovers on its weekly price charts. In February 2021, when Dogecoin recorded a golden cross on its weekly chart, the price increased in the following months.

Dogecoin saw a 3,600% increase after the price rose from a low of $0.02 on February 1, 2021, to reach an all-time high of $0.74 in May 2021.

A similar scenario played out in November 2024 following the appearance of a golden cross on the weekly chart. Starting from October of the same year, Dogecoin increased for eight consecutive weeks, reaching a high of $0.48 in December 2024, before receding.

However, the only visible death cross on the weekly chart produced a muted reaction, with Dogecoin price stagnation recorded in the aftermath. Dogecoin price traded in a range for months following the February 2023 death cross, with little momentum recorded shortly after the signal appeared.

At the time of writing, $DOGE was trading at $0.074.

0
0

Disclaimer: The content of this article solely reflects the author's opinion and does not represent the platform in any capacity. This article is not intended to serve as a reference for making investment decisions.

Understand the market, then trade.
Bitget offers one-stop trading for cryptocurrencies, stocks, and gold.
Trade now!

You may also like

Open-source weighted models take 72% market share in one year: Morgan Stanley warns that software dividends only flow to companies controlling complex workflows

The share of open-source weighted models has risen from 22% to 72% in one year. Morgan Stanley states that software dividends are not universally distributed, and value will flow to companies with the deepest moats and mastery of complex workflows.

智通财经•2026/10/27 02:37
Open-source weighted models take 72% market share in one year: Morgan Stanley warns that software dividends only flow to companies controlling complex workflows

The Safe-Haven Logic of Gold Has Changed! Morgan Stanley: It May Not Work When Stocks Plunge, But Can Hedge Against a US Treasury Crisis

Morgan Stanley stated that the myth of gold being a hedge against the stock market has ended. Since 2020, gold has not only failed to protect during extreme stock sell-offs but has actually amplified losses. However, its buffering value has become increasingly evident during sharp sell-offs in US Treasury bonds, transforming from a tool for interest rate trades into a core weapon against fiscal and sovereign credit risks. Record central bank gold purchases and the highest single-quarter ETF net inflows in history are reshaping the structural demand and logic behind gold prices, with Morgan Stanley setting a price target of $5,000/ounce by 2027.

华尔街见闻•2026/10/27 02:36
The Safe-Haven Logic of Gold Has Changed! Morgan Stanley: It May Not Work When Stocks Plunge, But Can Hedge Against a US Treasury Crisis