
Commodity Support and Resistance at a Glance: Gold, Silver, Oil, Gas + Platinum, Palladium, Copper, Agricultural Futures (July 8, 2026)

Huitong Finance July 8 News— An infographic on commodity support and resistance: gold, silver, oil, gas + platinum, palladium, copper + agricultural futures, updated at 07:40 (UTC+8) on Wednesday, July 8, 2026. It specifically covers 14 varieties including gold, silver, platinum, palladium, copper + crude oil, natural gas, fuel oil + wheat, corn, and cotton. For more details, see the exclusive charts by Huitong Finance Analyth.
An infographic on commodity support and resistance: gold, silver, oil, gas + platinum, palladium, copper + agricultural futures, updated at 07:40 (UTC+8) on Wednesday, July 8, 2026. It specifically covers 14 varieties including gold, silver, platinum, palladium, copper + crude oil, natural gas, fuel oil + wheat, corn, and cotton. For more details, see the exclusive charts by Huitong Finance Analyth.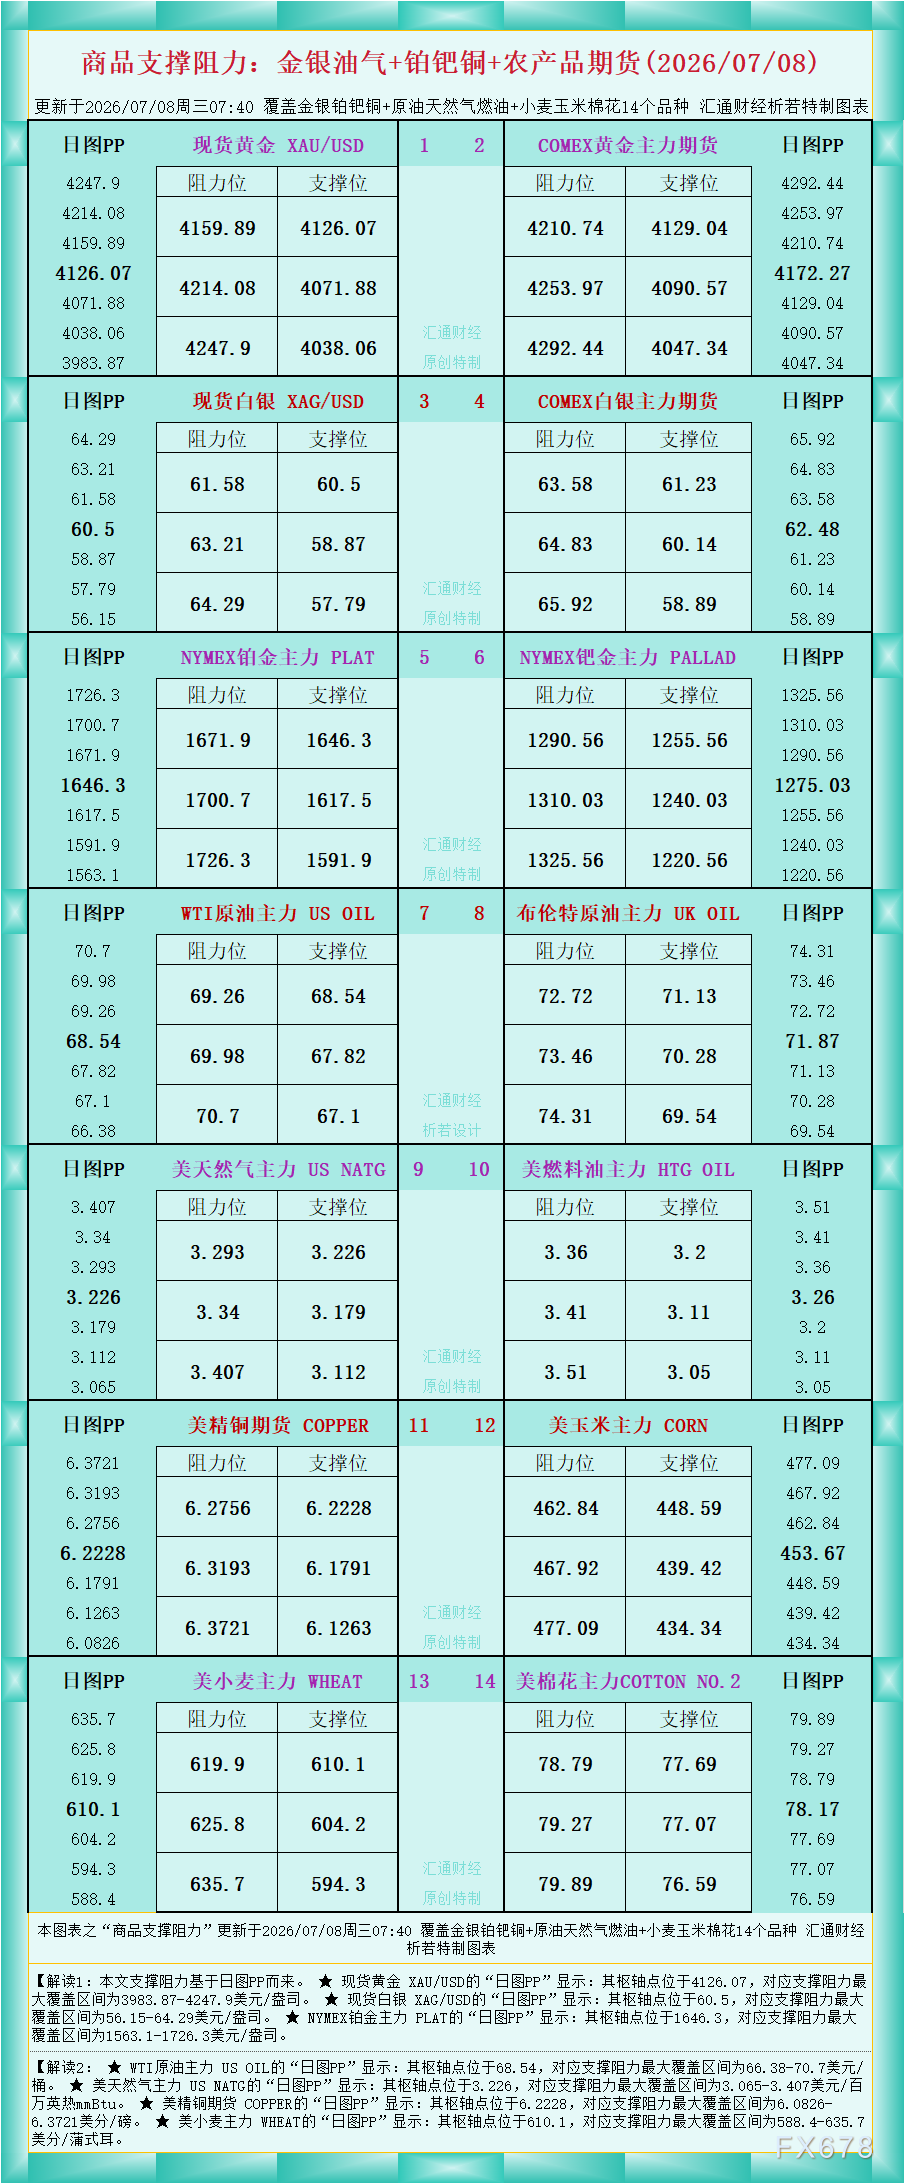
As shown in the chart, Interpretation 1: The support and resistance in this article are based on daily chart pivot points (PP).
★ The “daily chart PP” for spot gold XAU/USD shows: the pivot is at 4126.07, with the maximum support and resistance range at 3983.87–4247.9 USD/oz.
★ The “daily chart PP” for spot silver XAG/USD shows: the pivot is at 60.5, with the maximum support and resistance range at 56.15–64.29 USD/oz.
★ The “daily chart PP” for NYMEX platinum main contract PLAT shows: the pivot is at 1646.3, with the maximum support and resistance range at 1563.1–1726.3 USD/oz.
Interpretation 2:
★ The “daily chart PP” for WTI crude oil main US OIL shows: the pivot is at 68.54, with the maximum support and resistance range at 66.38–70.7 USD/barrel.
★ The “daily chart PP” for US natural gas main contract US NATG shows: the pivot is at 3.226, with the maximum support and resistance range at 3.065–3.407 USD/million British thermal units (mmBtu).
★ The “daily chart PP” for US copper futures COPPER shows: the pivot is at 6.2228, with the maximum support and resistance range at 6.0826–6.3721 cents/pound.
★ The “daily chart PP” for US wheat main contract WHEAT shows: the pivot is at 610.1, with the maximum support and resistance range at 588.4–635.7 cents/bushel.
For more variety-specific interpretations, refer to the chart. Original exclusive by Huitong Finance, all rights reserved, for reference only.
Disclaimer: The content of this article solely reflects the author's opinion and does not represent the platform in any capacity. This article is not intended to serve as a reference for making investment decisions.
You may also like
Swiss Franc weakens as US Dollar gains on Fed rate hike odds
From "chasing the light" to "going upstream toward the light"! Morgan Stanley asserts: In the tsunami of computing power, fiberglass fabric and copper foil ignite a super cycle in materials.
Morgan Stanley's latest research report points out that the global frenzy of AI infrastructure expansion is shifting from downstream GPU and wafer foundry to a comprehensive upstream spread in critical base material sectors.

As "AI slowdown" impacts the semiconductor sector, Goldman Sachs issues a bullish report! Target prices for the "Korean memory chip giants" indicate nearly 90% upside potential.
Goldman Sachs reaffirmed its “Buy” rating for the world’s two largest memory chip giants — Samsung Electronics and SK Hynix. Samsung Electronics continues to be on Goldman Sachs’ Conviction List.

Anthropic has been profitable for two consecutive quarters ahead of its IPO
Anthropic has achieved positive adjusted operating profit for two consecutive quarters, with Q2 revenue surging 14-fold year-on-year to $11.5 billion and annualized revenue reaching $65 billion. The gross margin exceeds 80%. The company has chosen to list on Nasdaq, with a potential valuation of up to $2 trillion. Dramatically, the CEO has made a rare call to slow down AI development just before the IPO. Analysts believe that balancing safety concerns with commercial competition will become the core challenge.
Crypto prices
More


