
At a Glance: "Pivot Points + Long/Short Position Signals" for Gold, Crude Oil, Forex, and Stock Indices on July 9, 2026

Huixun Finance July 9 Report—— Below is the latest series chart summarizing the “Pivot Point + Long/Short Position Signals” for gold, crude oil, forex, and stock indices, including graphical explanation and text analysis. By comparing the latest net long % with the previous net long % (the previous trading day's net long %), various position signals are interpreted, covering a total of 13 signals such as Net Long Expansion, Net Long Reduction, No Change in Net Short, Net Short Turned Balanced, etc. According to the actual data comparison results, several of these signals are displayed accordingly.
A chart: Snapshot of “Pivot Point + Long/Short Position Signals” for gold, crude oil, forex, and stock indices on July 9, 2026. Data released today (Thursday, July 9, 2026) show that as of now, there are 8 products in the chart that are in an “overbought” state (long positions above 80%), and 4 products in an “oversold” state (long positions less than 20%). Among them, the product with the highest proportion of long positions is: FTSE China A50 ☆FTSE China A50. Spot gold (XAU/USD) long position ratio: 87%, US crude oil (WTI OIL) long position ratio: 84%, Euro/US Dollar (EUR/USD) long position ratio: 44%. For detailed signal changes compared to yesterday and more comprehensive product lists, please refer to the customized chart by Huixun Finance.
In the signals for position changes, the number of products with net long expansion is 8, net long reduction is 7, net short expansion is 6, net short reduction is 2, and net short turned balanced is 1. The following products have long positions at 80% and above: Spot gold XAU/USD at a high of 87%, US crude oil WTI OIL at a high of 84%, Nasdaq 100 at a high of 82%, Euro/GBP at a high of 81%, Euro/JPY short positions at a high of 89%, GBP/USD short positions at a high of 84%, USD/JPY short positions at a high of 95%, USD/CAD short positions at a high of 83%, USD/CHF long positions at a high of 82%, NZD/USD long positions at a high of 83%.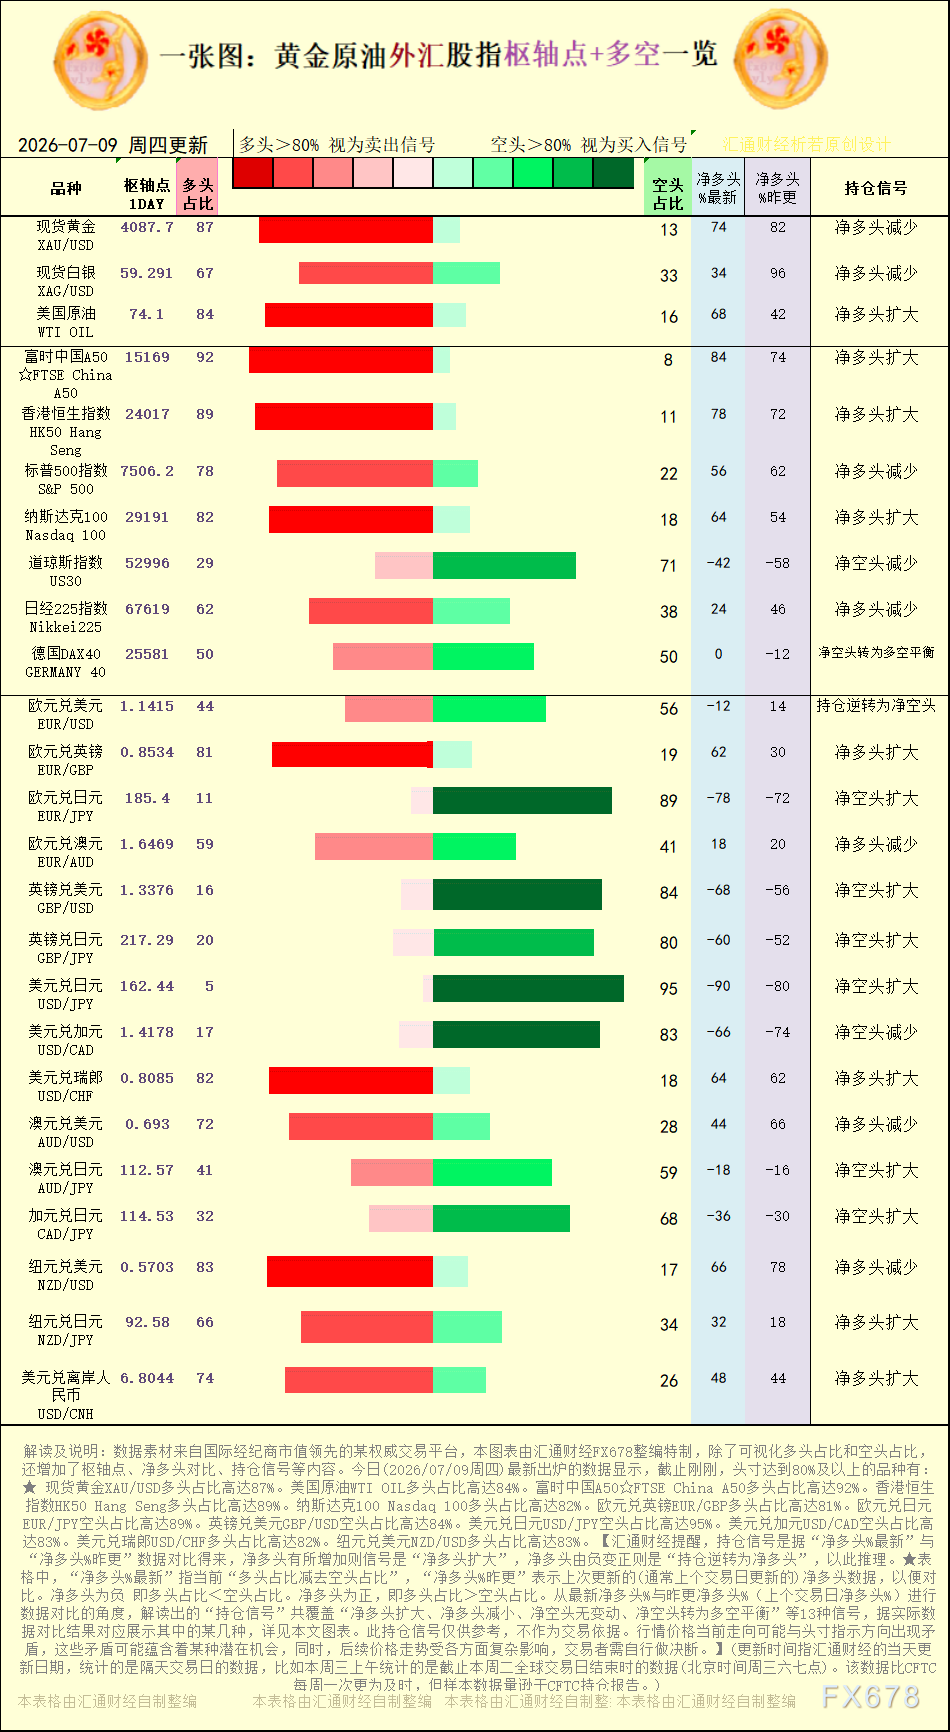
[Chart: Interpretation of pivot points and long/short position signals for gold, crude oil, forex, and stock indices, source: Customized chart by Huixun Finance. (Click the image to enlarge)]
Products showing net short reduction: Dow Jones Index US30, USD/CAD.
Products showing net long expansion: US crude oil WTI OIL, Nasdaq 100, EUR/GBP, USD/CHF, NZD/JPY, USD/CNH. Products showing net long reduction: Spot gold XAU/USD, spot silver XAG/USD, S&P 500 Index, Nikkei 225, EUR/AUD, AUD/USD, NZD/USD.
Huixun Finance reminds that the position signal is derived from comparing the “latest net long %” and the “previous net long %.” When the net long increases, the signal indicates “net long expansion,” and when the net long turns from negative to positive, it indicates a “reversal to net long.” In the table, “latest net long %” means the current percentage of long positions minus that of short positions; “previous net long %” refers to the data updated previously (usually the previous trading day) for easier comparison. Negative net long indicates that the percentage of long positions is less than that of short positions, and positive net long indicates the opposite. From the perspective of comparing the latest net long % with the previous net long %, the interpreted “position signals” cover a total of 13 types, such as “net long expansion, net long reduction, no change in net short, net short turning to long/short balance,” etc. Only some of them are displayed in the chart according to the actual data results. The current price trend may contradict the indicated direction of the positions, and such contradictions may carry potential opportunities. Meanwhile, subsequent price trends are influenced by various complex factors, and traders should make their own decisions.
[The trading products mentioned in this chart include: spot gold, spot silver, US crude oil, S&P 500 Index, Nasdaq 100, Dow Jones Index, German DAX40, EUR/USD, EUR/GBP, EUR/JPY, EUR/AUD, GBP/USD, GBP/JPY, USD/JPY, USD/CAD, USD/CHF, AUD/USD, AUD/JPY, CAD/JPY, NZD/USD.]
Disclaimer: The content of this article solely reflects the author's opinion and does not represent the platform in any capacity. This article is not intended to serve as a reference for making investment decisions.
You may also like
Swiss Franc weakens as US Dollar gains on Fed rate hike odds
From "chasing the light" to "going upstream toward the light"! Morgan Stanley asserts: In the tsunami of computing power, fiberglass fabric and copper foil ignite a super cycle in materials.
Morgan Stanley's latest research report points out that the global frenzy of AI infrastructure expansion is shifting from downstream GPU and wafer foundry to a comprehensive upstream spread in critical base material sectors.

As "AI slowdown" impacts the semiconductor sector, Goldman Sachs issues a bullish report! Target prices for the "Korean memory chip giants" indicate nearly 90% upside potential.
Goldman Sachs reaffirmed its “Buy” rating for the world’s two largest memory chip giants — Samsung Electronics and SK Hynix. Samsung Electronics continues to be on Goldman Sachs’ Conviction List.

Crypto prices
More


