
Will a Change in the Fed Chair Lead to a Sharp Decline in U.S. Stocks?

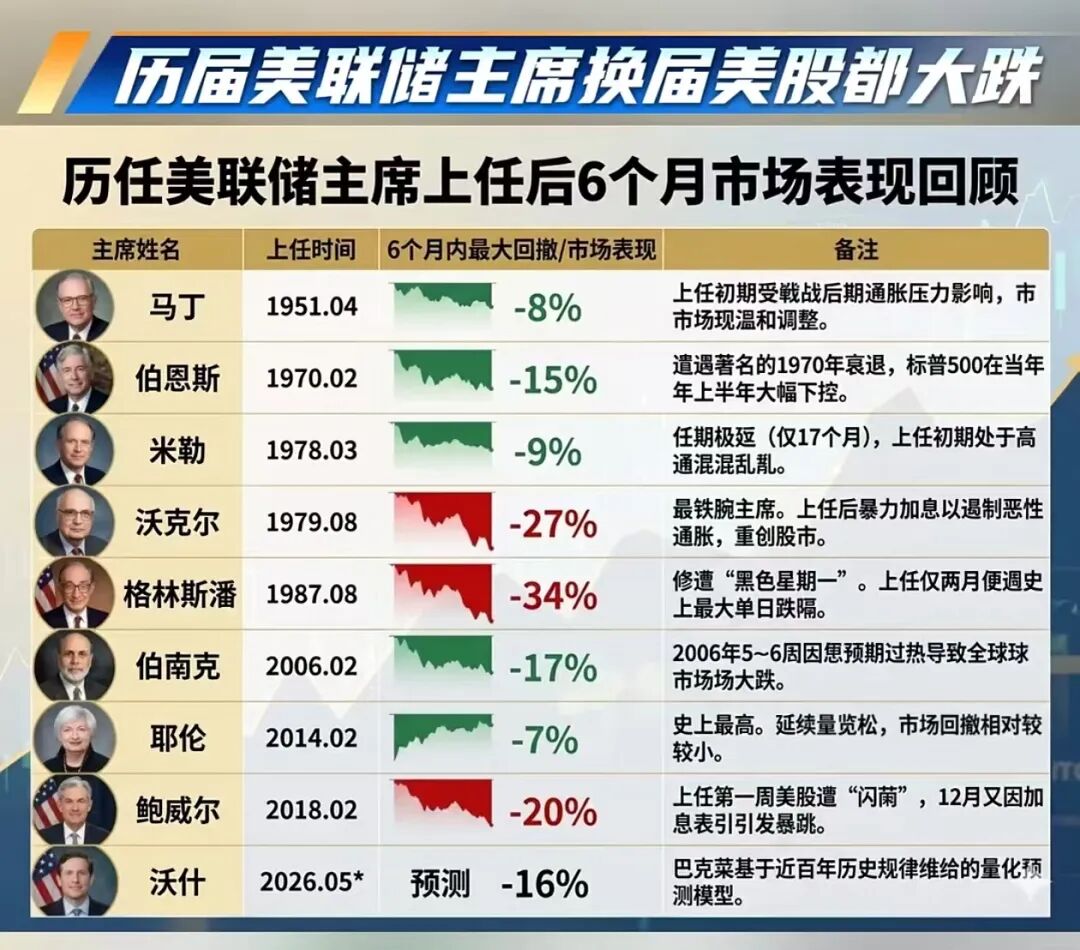
2. Taking Powell as an example: he was sworn in on February 5, 2018, but the early-2018 flash crash actually happened on January 26. If we use Method A, Powell's max drawdown in the 6 months after taking office was 2.56%. For Method B, the max drawdown was 9.45%. Both are far below what's shown in the chart.
3. Furthermore, no matter which drawdown calculation you use, the maximum drawdown in the 6 months after a new Fed Chair takes office is not significantly different from the maximum drawdown in any random 6 months in SP500 history.
4. If we use drawdown definition A:
1) The maximum drawdowns within 6 months after the last 7 chairmen took office are as follows:
Miller (1978-03-08): 0.00%
Volcker (1979-08-06): 4.25%
Greenspan (1987-08-11): 32.82%
Bernanke (2006-02-01): 4.58%
Yellen (2014-02-03): 0.00%
Powell (2018-02-05): 2.56%
2) The distribution of the maximum drawdown in any 6-month period for the SP500:
10th percentile: 0.09%
25th percentile: 1.44%
75th percentile: 8.98%
90th percentile: 16.24%
The two medians are almost identical. In the test for equal means, t-test: p=0.2870, Wilcoxon test: p=0.3438. There is no significant difference.
5. If we use drawdown definition B
1) The maximum drawdowns over 6 months after the last 7 chairmen took office are as follows:
Burns (1970-02-01): 23.21%
Miller (1978-03-08): 17.12%
Volcker (1979-08-06): 13.31%
Greenspan (1987-08-11): 33.51%
Bernanke (2006-02-01): 7.70%
Yellen (2014-02-03): 12.38%
Powell (2018-02-05): 9.45%
2) The distribution of maximum drawdowns in any historical 6-month period for the SP500:
10th percentile: 7.80%
25th percentile: 9.97%
75th percentile: 17.74%
90th percentile: 22.12%
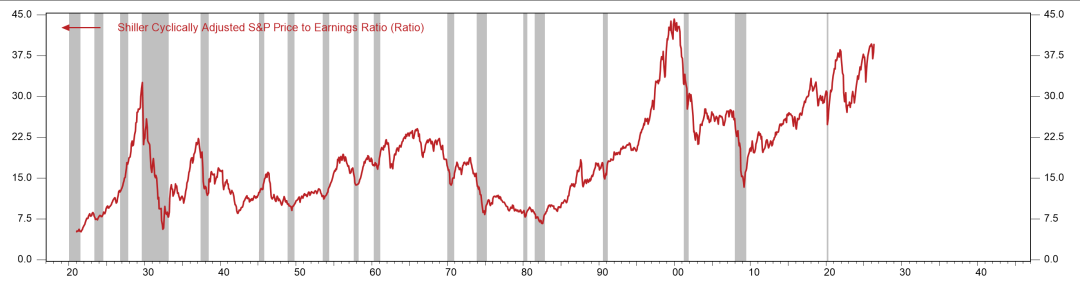
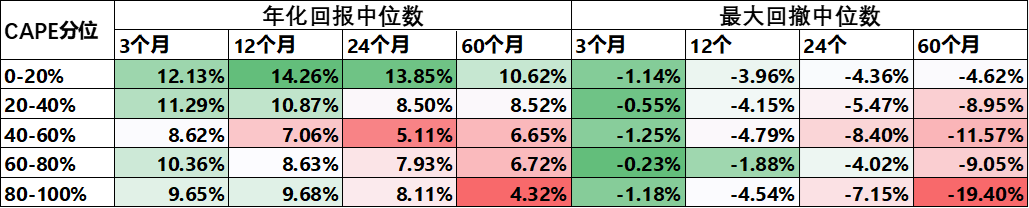
6. In summary, according to historical patterns, there is almost always a significant drawdown in the U.S. stock market within any given six months—this is historical normality, and the same can be expected for the next six months. It can even be inferred that, since U.S. stock valuations are at historical extremes, future drawdowns could be even greater than the historical median.

Disclaimer: The content of this article solely reflects the author's opinion and does not represent the platform in any capacity. This article is not intended to serve as a reference for making investment decisions.
You may also like
Pushing Forward Against the "AI Slowdown" Trend? Reports Suggest Kioxia Plans U.S. IPO to Raise at Least $10 Billion
Kioxia is reportedly considering raising $10 billion through a listing in the United States.

3 Altcoins Poised to Pump Soon: LTC, TRX, ADA

AI Computing Power Construction Shifts from "Lack of Electricity" to "Lack of Talent": Modularization Rises, Schneider, Vertiv, Eaton Embrace New Opportunities
Bernstein recently released a research report stating that, amid the rapid expansion of AI computing power, the main constraint affecting the development of data centers is undergoing a shift.

Zcash slides from $1,300, risk of $850 pullback before new rally
Crypto prices
More


