Bitget App
Trade smarter
Buy cryptoMarketsTradeFuturesEarnAISquareMore
XRP Is Back: Rare Reversal Appears on Market

XRP Is Back: Rare Reversal Appears on Market

CryptoNewsNetCryptoNewsNet2026/07/10 19:00
By:CryptoNewsNet
Back to the list

XRP Is Back: Rare Reversal Appears on Market

XRP Is Back: Rare Reversal Appears on Market image 0  u.today 11 m
XRP Is Back: Rare Reversal Appears on Market image 1

One of $XRP's most notable recovery patterns in recent months might be on display. In contrast to many reversals that start with traditional technical formations like inverse head-and-shoulders patterns, double bottoms, or capitulation spikes, $XRP's most recent rebound seems to be emerging naturally through a slow change in market structure.

Bears are losing control

$XRP has been stuck in a steady downward trend on the daily chart for the majority of 2026. The asset was frequently driven lower by lower highs and lower lows, and the 50-day and 100-day moving averages served as dynamic resistance levels. However, it appears that sellers are starting to lose control based on recent price action.

The departure from the sharply declining trajectory that dominated June trading is the most noteworthy development. Without first creating a textbook reversal pattern, $XRP has begun printing higher lows. Instead of a dramatic flush followed by an explosive recovery, buyers have quietly stepped in near the $1.00 psychological support zone and consistently defended it.
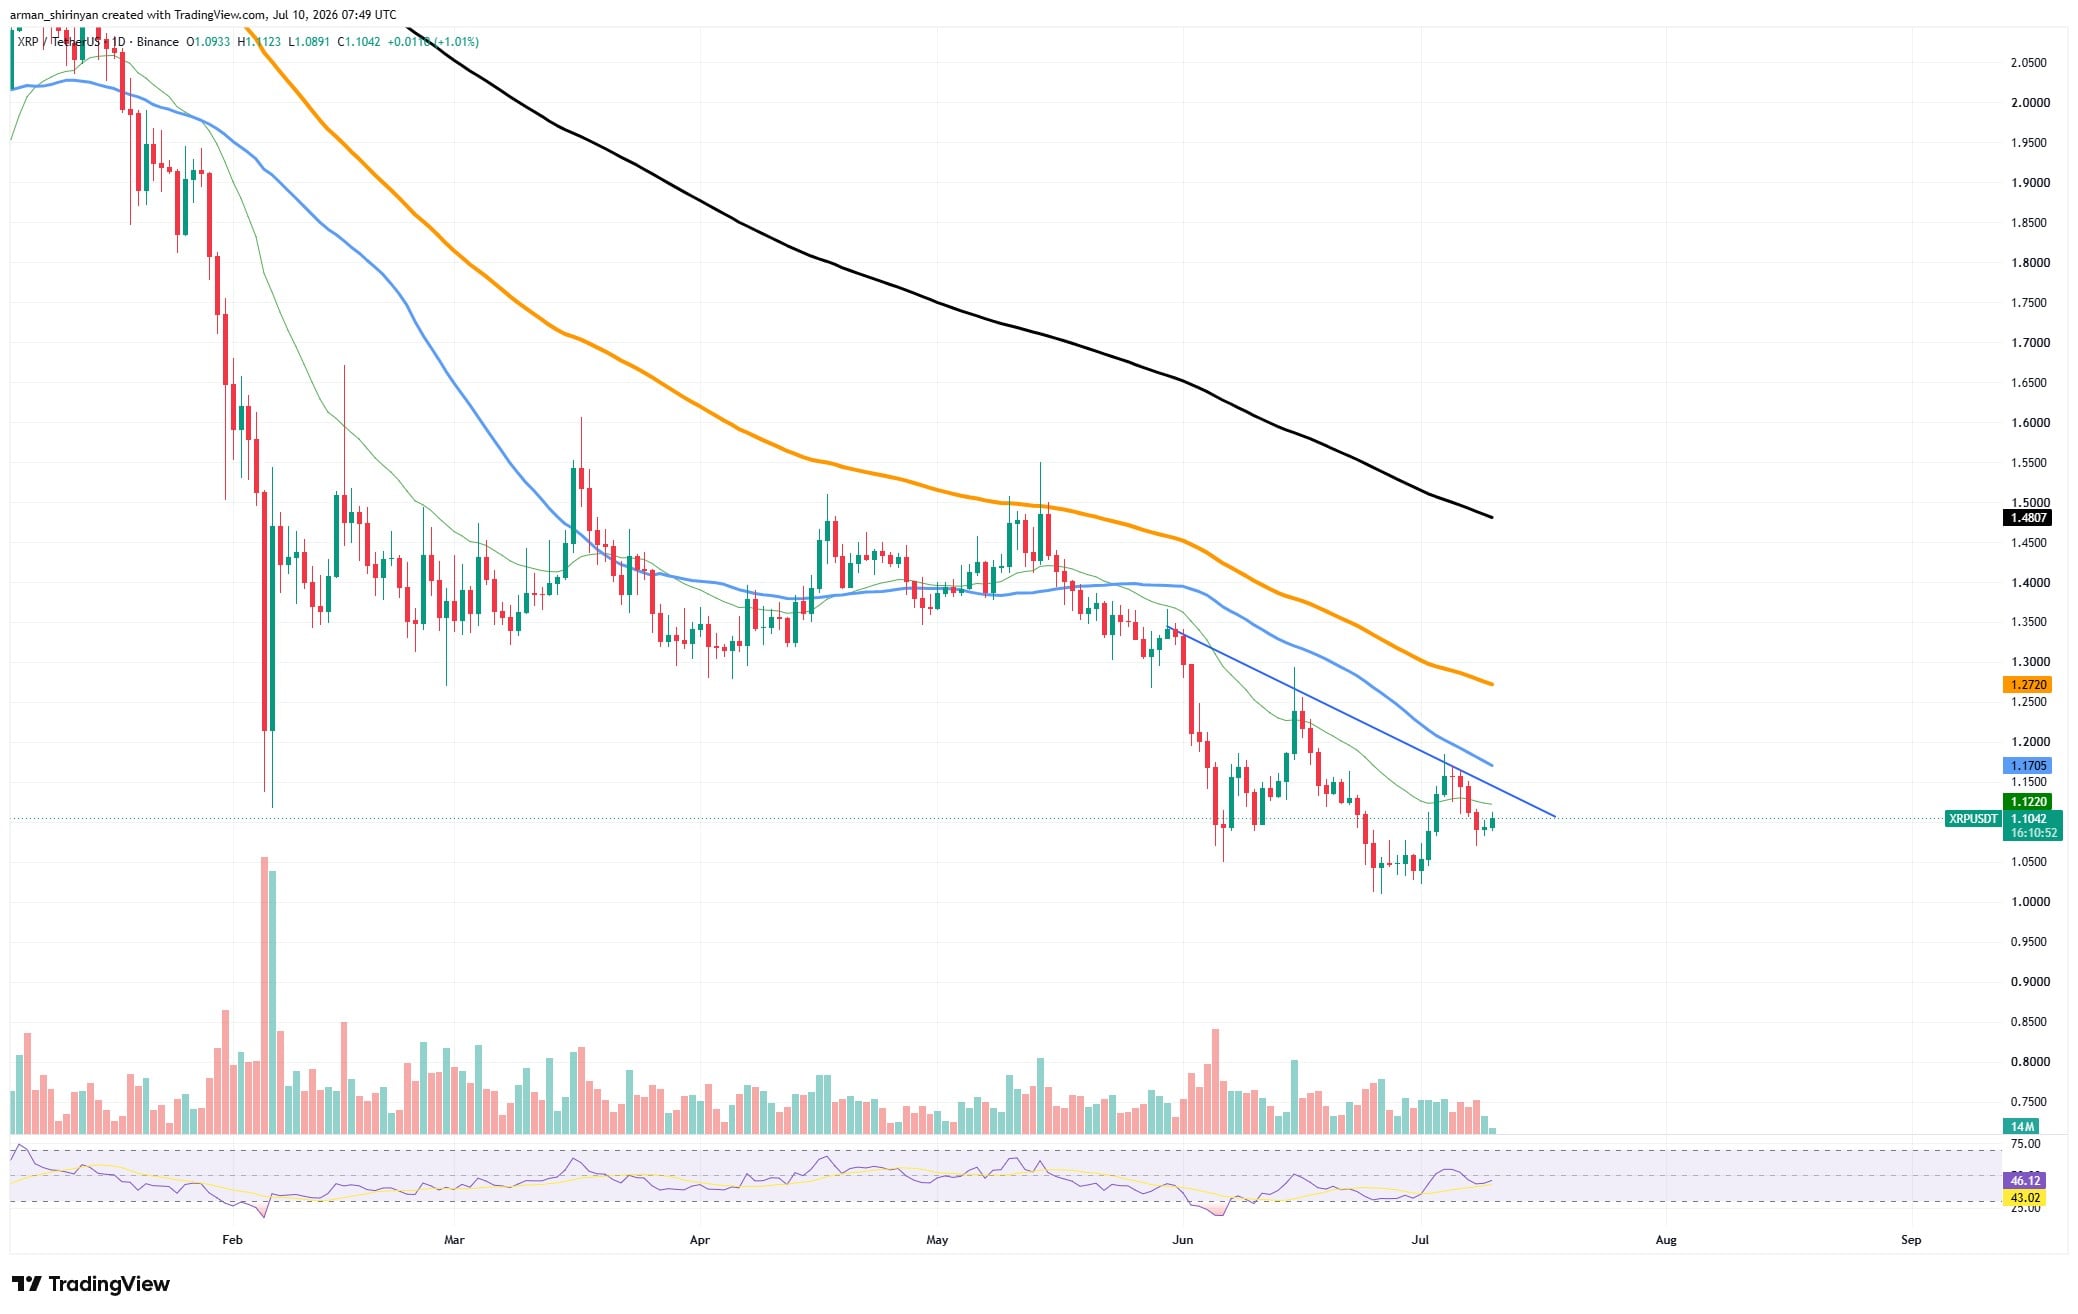
XRP Is Back: Rare Reversal Appears on Market image 2 $XRP/USDT Chart by TradingView

This makes the current setup relatively rare. Markets frequently turn around after panic-driven selling events that produce clear bottoming structures. $XRP, by contrast, appears to be stabilizing through accumulation. Alongside the price structure's slow improvement, the RSI has recovered and is starting to trend upward after moving out of oversold territory. The way $XRP interacts with the declining resistance trendline is another positive indication.

Long way to go

The price is currently trading directly below important moving averages that are grouped around the $1.15-$1.18 region after repeatedly challenging this barrier. Short-term momentum has returned to the bulls if there is a successful breakout above this area. While $XRP is trading below its longer-term moving averages, especially the 200-day EMA around $1.48, the overall trend is still negative.

But markets don't instantly go from being bearish to being bullish. They usually go through a stabilization phase first, and $XRP seems to be going through just that. The next target might appear between $1.25 and $1.30, where the 100-day moving average is currently located, if buyers are successful in pushing $XRP above adjacent resistance levels.

If it doesn't break higher, there will probably be another test of support around $1.00. For the time being, the fact that $XRP's recovery is not driven by a traditional bottom pattern makes it stand out. One higher low at a time, it is being built organically.

0
0

Disclaimer: The content of this article solely reflects the author's opinion and does not represent the platform in any capacity. This article is not intended to serve as a reference for making investment decisions.

Understand the market, then trade.
Bitget offers one-stop trading for cryptocurrencies, stocks, and gold.
Trade now!

You may also like

Three Giants Call for "Slowdown": AI Confidence Wavers, Oil Prices Break $100, Federal Reserve Rate Hike Imminent—U.S. Stocks May Face the Most Dangerous Week This Year

The Federal Reserve may raise interest rates, AI slowdown severely impacts chip stocks, Saudi pipeline attack drives up oil prices—this week, the US stock market faces a dual pressure test from inflation and risk appetite.

智通财经2026/09/14 02:06
Three Giants Call for "Slowdown": AI Confidence Wavers, Oil Prices Break $100, Federal Reserve Rate Hike Imminent—U.S. Stocks May Face the Most Dangerous Week This Year

AI development slowdown combined with surging oil prices hit Japanese and Korean chip stocks first, SK Hynix falls more than 5%, SoftBank plunges 11%

AI giants have made a rare joint call to slow down the development of advanced models. The South Korean and Japanese stock markets have declined, with the Seoul Composite Index falling over 3% and the Nikkei 225 Index dropping more than 2%. SoftBank plunged 11% in a single day, while SK Hynix dropped over 5%. Meanwhile, Saudi Arabia has shut down oil pipelines, pushing Brent crude prices up to $107. Combined with the US CPI exceeding expectations, the probability of a Fed rate hike on Wednesday is now over 90%. The double whammy has led to a turbulent opening for Asian markets.

华尔街见闻2026/09/14 01:31

ASIC and optical interconnects drive high-speed growth! Bank of America strongly supports the soaring Marvell (MRVL.US), claiming there's still 55% upside potential

Bank of America maintains its $365 price target for Marvell, citing its focus on expanding revenue per AI system through custom AI accelerators (i.e., AI ASIC/XPU) and supporting optical interconnect chips, driven by massive demand for AI agents. Compared to the September 11 closing price of $236.10, this target implies a potential upside of approximately 54.6%.

智通财经2026/09/14 01:26
ASIC and optical interconnects drive high-speed growth! Bank of America strongly supports the soaring Marvell (MRVL.US), claiming there's still 55% upside potential