
A Visual Guide to Commodity Support and Resistance: Gold, Silver, Oil, Gas + Platinum, Palladium, Copper, Agricultural Futures (July 13, 2026)

Huitong Financial, July 13—— One chart to view commodity support and resistance: Gold, Silver, Oil, Gas, Platinum, Palladium, Copper, and Agricultural Product Futures. Updated on Monday, July 13, 2026, 07:00 (UTC+8). Specifically covers 14 categories: Gold, Silver, Platinum, Palladium, Copper, Crude Oil, Natural Gas, Fuel Oil, Wheat, Corn, Cotton, and more. For more details, see the exclusive charts customized by Huitong Financial.
One chart to view commodity support and resistance: Gold, Silver, Oil, Gas, Platinum, Palladium, Copper, and Agricultural Product Futures. Updated on Monday, July 13, 2026, 07:00 (UTC+8). Specifically covers 14 categories: Gold, Silver, Platinum, Palladium, Copper, Crude Oil, Natural Gas, Fuel Oil, Wheat, Corn, Cotton, and more. For more details, see the exclusive charts customized by Huitong Financial.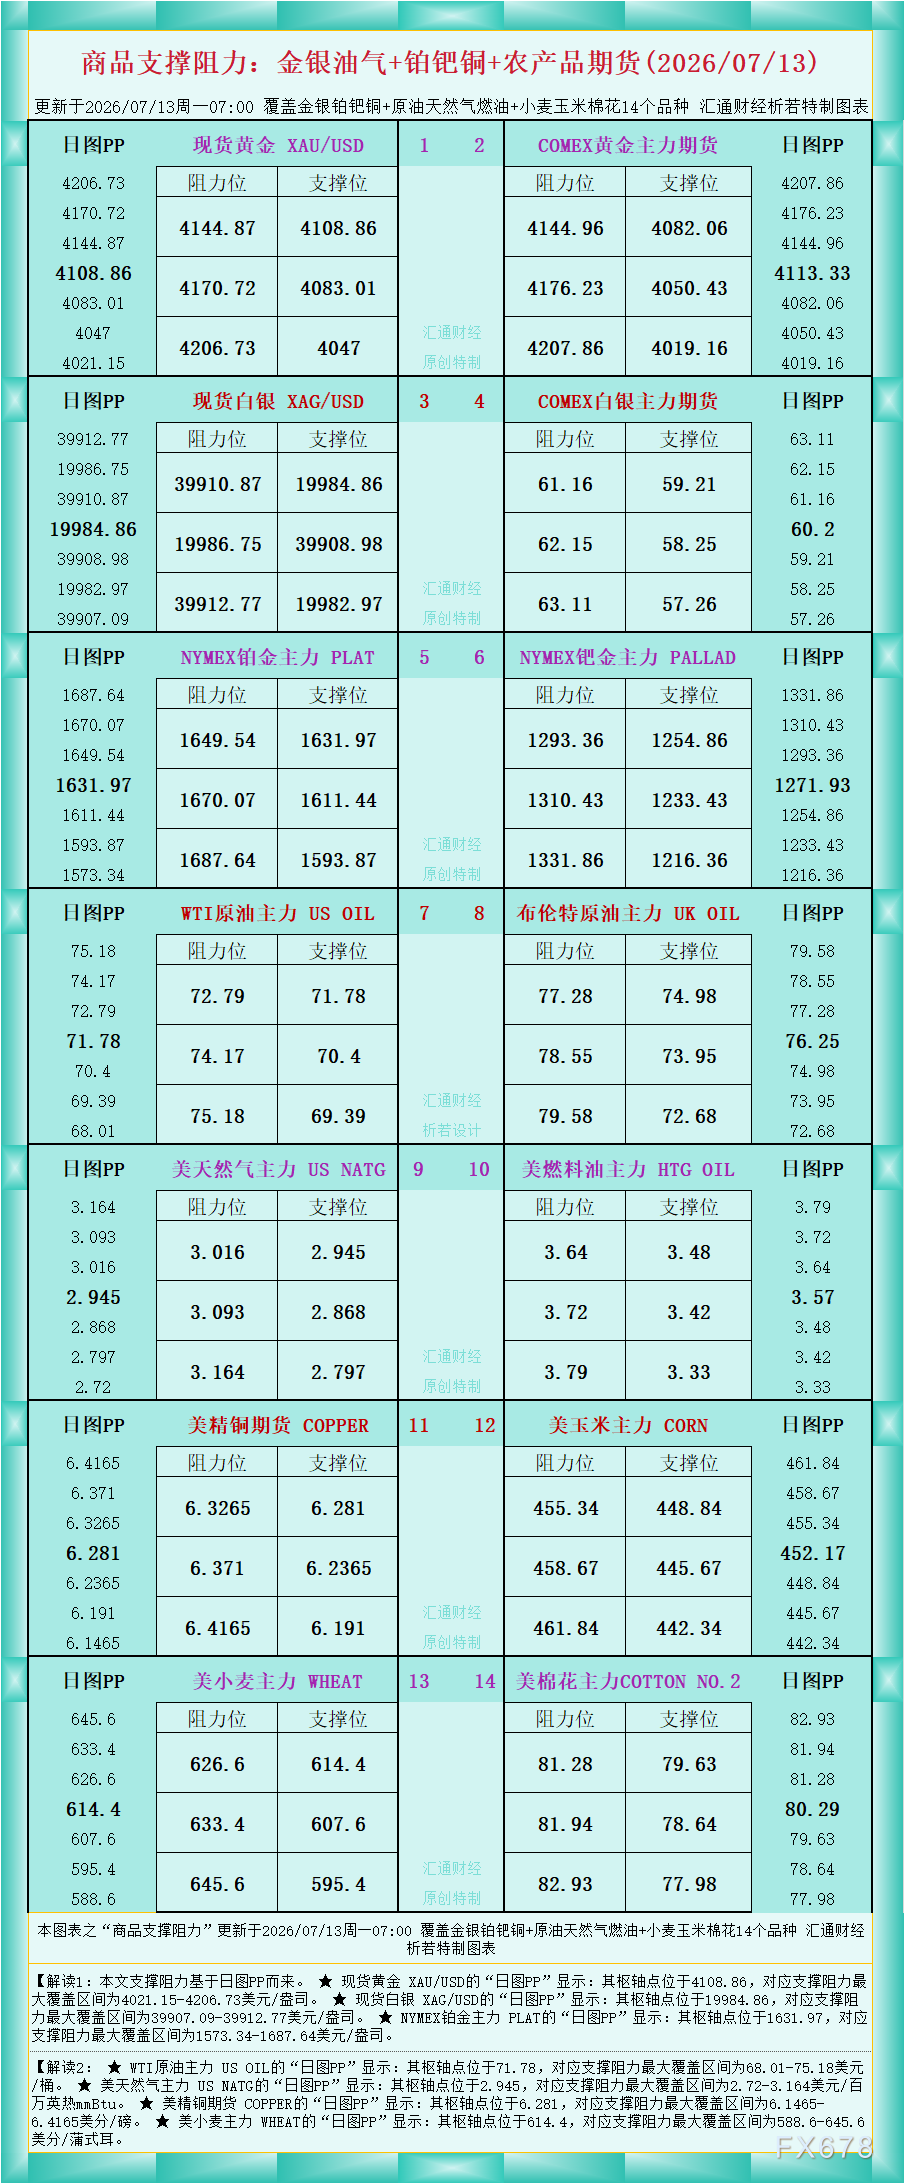
As shown in the chart data, Interpretation 1: The support and resistance in this article are based on daily chart PP.
★ For Spot Gold (XAU/USD), the “Daily PP” shows: the pivot point is at 4108.86, and the maximum support-resistance range is $4021.15–$4206.73 per ounce.
★ For Spot Silver (XAG/USD), the “Daily PP” shows: the pivot point is at 19984.86, and the maximum support-resistance range is $39907.09–$39912.77 per ounce.
★ For NYMEX Platinum main contract (PLAT), the “Daily PP” shows: the pivot point is at 1631.97, and the maximum support-resistance range is $1573.34–$1687.64 per ounce.
Interpretation 2:
★ For WTI Crude Main Contract (US OIL), the “Daily PP” shows: the pivot point is at 71.78, and the maximum support-resistance range is $68.01–$75.18 per barrel.
★ For US Natural Gas main contract (US NATG), the “Daily PP” shows: the pivot point is at 2.945, and the maximum support-resistance range is $2.72–$3.164 per million British thermal units (mmBtu).
★ For US Copper Futures (COPPER), the “Daily PP” shows: the pivot point is at 6.281, and the maximum support-resistance range is 6.1465–6.4165 cents per pound.
★ For US Wheat main contract (WHEAT), the “Daily PP” shows: the pivot point is at 614.4, and the maximum support-resistance range is 588.6–645.6 cents per bushel.
For further interpretations of more varieties, refer to the chart. Original customization by Huitong Financial, all rights reserved.
Disclaimer: The content of this article solely reflects the author's opinion and does not represent the platform in any capacity. This article is not intended to serve as a reference for making investment decisions.
You may also like
AI Bubble, Diesel Shock, Surging Yields! Bank of America’s Hartnett Warns of Approaching Autumn Stagflation Risk
Bank of America Chief Strategist Hartnett issued a triple warning: the diesel crack spread has reached a historic high of $102 per barrel, the 30-year U.S. Treasury yield has risen to its highest level since 2007, and under the AI frenzy, total factor productivity (TFP) has fallen below its long-term trend line—signaling a convergence of stagflation risks this autumn. He warns that “a complacent market combined with tough policies is a breeding ground for volatility,” and bluntly states, “It’s not too late to hedge against the AI bubble now.”
Canadian Dollar gains support from higher oil prices amid Saudi pipeline disruptions
Three Giants Call for "Slowdown": AI Confidence Wavers, Oil Prices Break $100, Federal Reserve Rate Hike Imminent—U.S. Stocks May Face the Most Dangerous Week This Year
The Federal Reserve may raise interest rates, AI slowdown severely impacts chip stocks, Saudi pipeline attack drives up oil prices—this week, the US stock market faces a dual pressure test from inflation and risk appetite.

Crypto prices
More


