
A Visual Overview of Commodity Support and Resistance: Gold, Silver, Oil, Gas + Platinum, Palladium, Copper, Agricultural Futures (July 22, 2026)

Huitong Finance July 22—— A chart shows commodity support and resistance: Gold, Silver, Oil & Gas + Platinum, Palladium, Copper + Agricultural Futures. Updated at 07:15 on Wednesday, July 22, 2026, covering 14 varieties including gold, silver, platinum, palladium, copper, crude oil, natural gas, fuel oil, wheat, corn, cotton, etc. For more details, refer to the customized chart provided by Huitong Finance's Analysis Department.
A chart shows commodity support and resistance: Gold, Silver, Oil & Gas + Platinum, Palladium, Copper + Agricultural Futures. Updated at 07:15 on Wednesday, July 22, 2026 (UTC+8), covering 14 varieties including gold, silver, platinum, palladium, copper, crude oil, natural gas, fuel oil, wheat, corn, cotton, etc. For more details, refer to the customized chart provided by Huitong Finance's Analysis Department.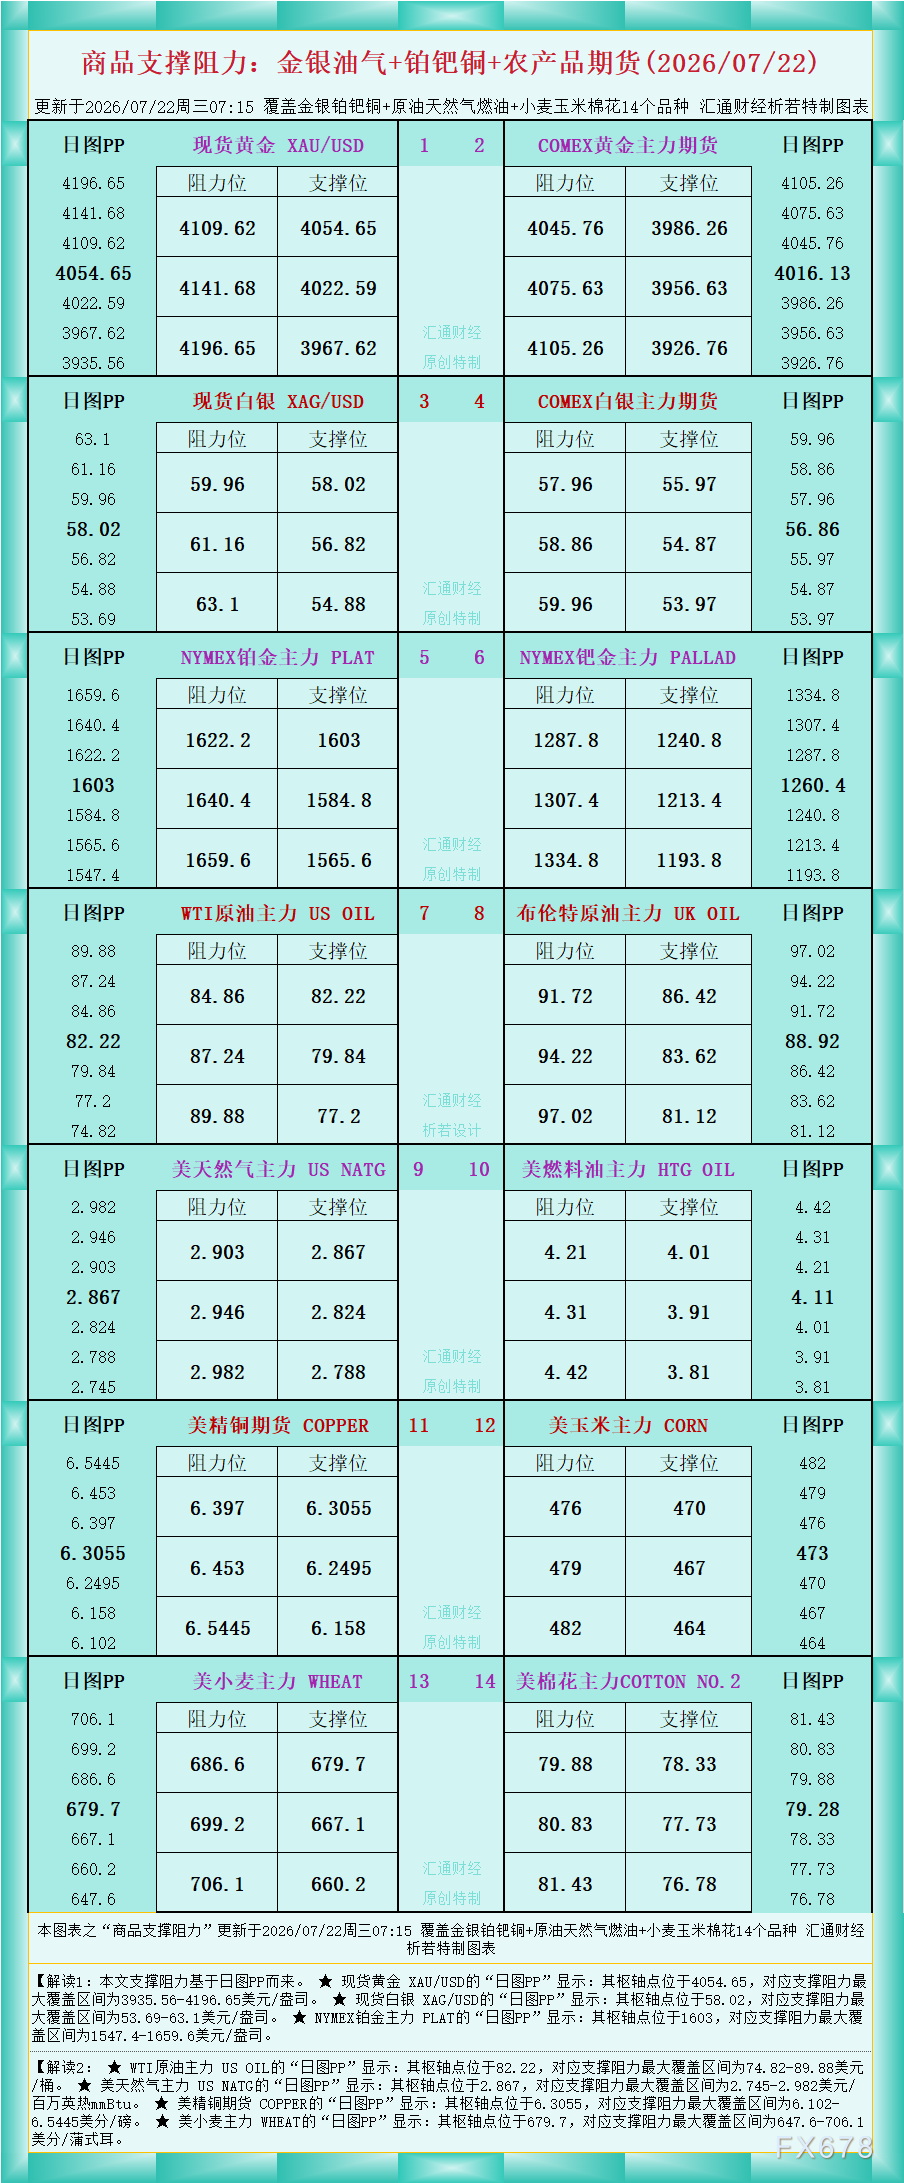
As shown in the chart, Interpretation 1: The support and resistance values in this article are based on daily chart PP.
★ For spot gold XAU/USD, the “Daily Chart PP” shows: The pivot point is at 4054.65, with the maximum support and resistance range between $3935.56 and $4196.65 per ounce.
★ For spot silver XAG/USD, the “Daily Chart PP” shows: The pivot point is at 58.02, with the maximum support and resistance range between $53.69 and $63.1 per ounce.
★ For NYMEX platinum main contract PLAT, the “Daily Chart PP” shows: The pivot point is at 1603, with the maximum support and resistance range between $1547.4 and $1659.6 per ounce.
Interpretation 2:
★ For WTI crude oil main contract US OIL, the “Daily Chart PP” shows: The pivot point is at 82.22, with the maximum support and resistance range between $74.82 and $89.88 per barrel.
★ For US natural gas main contract US NATG, the “Daily Chart PP” shows: The pivot point is at 2.867, with the maximum support and resistance range between $2.745 and $2.982 per million British thermal units (mmBtu).
★ For US copper futures COPPER, the “Daily Chart PP” shows: The pivot point is at 6.3055, with the maximum support and resistance range between 6.102 and 6.5445 cents per pound.
★ For US wheat main contract WHEAT, the “Daily Chart PP” shows: The pivot point is at 679.7, with the maximum support and resistance range between 647.6 and 706.1 cents per bushel.
For analysis of more varieties, please refer to the chart. Originally customized and copyrighted by Huitong Finance.
Disclaimer: The content of this article solely reflects the author's opinion and does not represent the platform in any capacity. This article is not intended to serve as a reference for making investment decisions.
You may also like
Crypto Regulation Deal Collapses: 5 Altcoins to Watch Before Volatility Turns Into the Next Buying Opportunity

Jiayin Technology (JFIN.US) Holds 500 Million Cash in First Half of Year, Overseas Market Bet Becomes the Key to Breakthrough
Jiayin Financial Technology (JFIN.US) released its financial report for the first half of 2026, reporting revenue of 1.494 billion yuan, gross profit of 613 million yuan, and a gross margin of 41.03%.

The electricity equipment giant priced as a software stock? GE Vernova (GEV.US) faces a short attack from GLJ; Bernstein responds: It's not just data centers, utilities are the real trump card.
After experiencing a sharp decline on Monday, GE Vernova stabilized on Tuesday. However, debates surrounding this power equipment giant are intensifying in the market.

Crypto prices
More


