
How to observe the "Super El Niño Trade"? Oil and gas "react the fastest," while "tropical agricultural products" such as palm oil, coconut oil, and rubber have the greatest elasticity

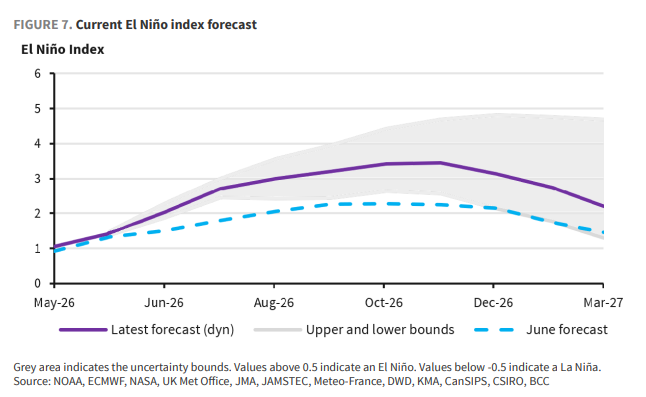
Seasonal climate forecasts indicate that 2026 may see the strongest El Niño event on record. Faced with this potentially historic climate shock, how the commodity markets will respond has become one of the primary concerns for investors at present.
According to Chasing Wind Trading Desk, Barclays pointed out in its cross-asset research report released on July 21 that oil and gas prices are historically the quickest to react during the El Niño cycle—El Niño events often bring warmer winters to the Northern Hemisphere, suppressing heating demand and limiting Atlantic hurricane activity, which in turn drags down both natural gas and crude oil prices. Meanwhile, tropical agricultural commodities concentrated in Southeast Asia, such as palm oil, coconut oil, and rubber, exhibit the strongest historical upward elasticity. Within 18 months after a strong El Niño event, prices for these products can rise by as much as 30% to 40%.
Barclays’ analytical framework divides the El Niño response of commodities into three tiers: energy commodities react first, followed by tropical agricultural commodities, while industrial metals respond with a noticeable lag—often only showing changes a year after the event occurs. This timing difference provides a reference path for investors to stagger their allocations. Notably, the report also reminds that historical price changes reflect statistical patterns, not predictions for future trends; macroeconomic conditions, supply and demand fundamentals, and geopolitical factors could all dictate the actual outcomes of specific events.
Oil & Gas: The First to React, but Trend Downward
During El Niño cycles, natural gas and crude oil are the commodities whose prices respond most quickly, but their direction is opposite to that of tropical agricultural products—historical data shows that both tend to weaken in price.
Analysis reveals that under El Niño conditions, European natural gas prices have historically ranged 9% to 28% below trend levels, with greater strength correlating to bigger deviations. The transmission mechanism is clear: El Niño brings warmer winters to the Northern Hemisphere, reduces heating demand, boosts European end-winter inventories, and subsequently lowers summer LNG restocking demand. If the winter of 2026/27 is mild, European end-winter inventories could be significantly above normal, exerting prolonged downward pressure on gas prices.
For U.S. natural gas, strong El Niño events have historically had better predictive power for milder winters compared to other weather conditions. During the 2015-16 El Niño, the index reached 2.8, leading to a 16% reduction in winter heating degree days (HDD) compared with the seven-year average. Current climate models show this El Niño index could track as high as +3 to +4, implying a 15% to 20% downside risk to winter HDD—or a demand loss of about 4 to 5 Bcf/d. Combined with persistently increasing associated gas supply from the non-price-sensitive Permian Basin, the downside risk for U.S. gas prices is substantial.
As for crude oil, oil prices should be viewed more as "La Niña-sensitive" rather than "El Niño-sensitive" commodities. During El Niño periods, oil prices have historically ranged 5% to 30% below trend levels; while in La Niña phases, historical averages are 17% to 40% above trend. The rebound in oil prices after El Niño events largely reflects the subsequent La Niña phase, not a lagged effect of El Niño itself.
Tropical Agricultural Commodities: Greatest Elasticity, High Conviction Trades
Barclays identified palm oil, coconut oil, and rubber as the most El Niño-sensitive and historically reliable commodities in the entire complex. Their common feature: production is highly concentrated in Southeast Asia, the very region most impacted by El Niño-induced heat and drought.
Palm oil is the highest conviction El Niño trade. Indonesia and Malaysia together account for nearly 90% of global supply. Research from the Malaysian Palm Oil Board (MPOB) estimates that an average El Niño event can reduce palm oil output by about 3%, reduce stocks by about 2.5%, and drive prices up by about 10%. Historical analysis further shows that after strong El Niño events, actual prices have risen about 26% over 12 months and climbed to nearly 40% over 18 months; samples of extremely strong events show a 12-month gain of about 34%. Notably, palm oil prices often underperform trend levels during the El Niño event itself, suggesting the onset is a window for positioning rather than the strongest price performance period.
Coconut oil production is highly concentrated in the Philippines and Indonesia. According to the USDA, El Niño in 2024 led to a nearly 12% decrease in Philippine coconut oil production. Analysis shows that after mild El Niño events, coconut oil prices have risen by about 16% at 12 months and about 25% at 18 months; strong El Niño events correspond to 18-month gains of about 33%, with extremely strong samples gaining as much as 50% to 60%.
In the case of natural rubber (RSS3), Thailand, Indonesia, and Vietnam together account for the majority of global supply. The heat and drought brought by El Niño reduce latex flow, shorten the tapping season, and compress output. During the 2023-24 El Niño, production in Thailand was estimated to drop by about 10%, Indonesia by about 15%. Historical analysis shows that after mild El Niño events, rubber prices rise 8% to 10% over one year, while strong events bring 15% to 20% gains. The statistical relationship is robust, though price gains between individual events vary widely.
The response logic for soybean oil is somewhat different. The main production regions are in the Americas, where El Niño typically brings favorable conditions. However, as soybean oil directly competes with palm and coconut oil in global food and biofuel markets, its price is greatly affected by the spillover effects of tighter tropical oil supplies. Brazilian soybean oil's sensitivity to El Niño is higher than that of soybeans themselves, but lower than for palm and coconut oil.
For rice, El Niño impacts prices by weakening the Indian summer monsoon and increasing drought risks in major producers such as India, Thailand, Vietnam, Indonesia, and the Philippines. After mild El Niño events, actual rice prices rise about 5% to 8% over 12 to 18 months; strong El Niño events correspond to gains of about 10% to 20%.
Industrial Metals: Lagged Response, Aluminum Most Prominent
Unlike agricultural products, industrial metals generally respond with a lag to El Niño, and the signals vary in strength. Aluminum stands out as the most clearly El Niño-sensitive among industrial metals, while copper’s signals are relatively weak.
The aluminum transmission mechanism is clear: China's Yunnan province hosts about 6.6 million tons/year of primary aluminum capacity (about 9% of the global total), and is highly dependent on hydropower (about 60% to 70%). El Niño systematically weakens the Bay of Bengal summer monsoon, resulting in low reservoir levels in Yunnan and forcing smelters to cut capacity. The 2015-16 drought cut about 300,000 tons, while the 2023-24 drought led to another 1.15 million tons of capacity being ordered offline. If this super El Niño brings another 20% capacity cut, some 1.3 million tons of aluminum production—the equivalent of 1.7% of global supply—would be at risk. In terms of pricing, aluminum typically underperforms during El Niño events themselves, but then strengthens gradually over the subsequent one to two years.
For copper, Chile’s northern regions (Atacama/Antofagasta/Tarapaca) concentrate about 4.2 million tons/year of copper capacity (about 17% of global supply), and were severely affected by the March 2015 floods. If the 2026-27 super El Niño peaks in October-November 2026, the highest risk for rainfall would fall between February and April 2027. However, historical analysis indicates copper prices show relatively weak statistical correlation to El Niño, with macroeconomic factors, Chinese demand, and energy transition investments having greater impacts on copper than weather events do.
Thermal coal responds most slowly. Historically, coal prices only see marked strength in the second year after an El Niño event, driven by reduced hydropower output in Asia, increased demand for heating, and tightening maritime shipping markets.
Other Agricultural Products: Complex Signals, Need to Distinguish El Niño from La Niña Effects
Corn, soybeans, wheat, sorghum, and other staple grains have a more complex response to El Niño, and Barclays takes a cautious approach toward these commodities' El Niño signals.
The common feature among these crops: El Niño tends to improve growing conditions in the Americas, leading to falling prices early in the event; subsequent price rebounds are more likely driven by the following La Niña phase rather than any lagged effect from El Niño itself. For grains and cotton, analysis should focus on price responses within 12 months after the event, rather than over longer periods.
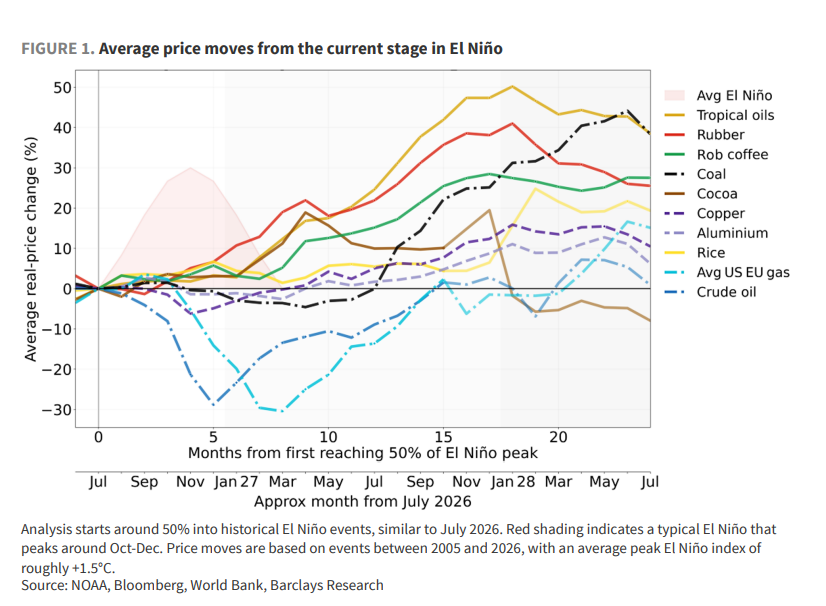
For cocoa, historical outcomes vary widely between events—a handful of major supply shocks contribute most of the observed price signals. Robusta coffee, with Vietnam and Indonesia as main producers, is directly exposed to El Niño-driven drought risk. After strong El Niño events, its price has historically risen about 7% to 13% over 12 months, although the statistical evidence is weaker than for palm oil and other commodities.
La Niña—especially persistent La Niña events—often delivers clearer market signals than El Niño. During the sustained La Niña from 2020 to 2023, sugar, energy, and other major commodity markets exhibited significant volatility. This means investors should not only pay attention to the current El Niño cycle, but also closely track potential opportunities arising from an ensuing La Niña phase.
Disclaimer: The content of this article solely reflects the author's opinion and does not represent the platform in any capacity. This article is not intended to serve as a reference for making investment decisions.
You may also like
Why Is NEAR Dropping? Open Interest, Funding Rate, and RSI Signal Explained

Why Is UNI Up 4.84% While REZ Drops 15% Today? Here’s What the Data Says

Why Is USELESS Dropping 4.84%? Open Interest, Funding Rate, and RSI Signal Explained

As the 10-year US Treasury yield breaks above 5% and Japanese bond yields fall below 3%, global bond market pressure surges!
Global bond markets are sounding the alarm as US Treasury yields break 5%, reaching their highest level since 2007, and Japanese bond yields hit a 30-year high. Soaring oil prices, persistent inflation, and mounting debt are triggering a wave of sell-offs. Institutions warn: 5% is by no means the endpoint—6% is now in sight! With US and Japan central bank decisions imminent this week, a more intense asset storm may just be beginning.
Crypto prices
More


