Hyperliquid’s native token, HYPE, is sitting at a pivotal point on the chart this week. In a recent post, Joao Wedson, founder of analytics platform Alphractal, said, “Many traders will soon be liquidated on Hyperliquid (HYPE).”
According to him, the outcome is inevitable. Two liquidation heatmaps he shared help explain why he’s so confident in that call.
HYPE is trading around $58 at press time, down 15% over the past week. From its all-time high of roughly $76.85, set on June 16, 2026, the token is down more than 24%.
HYPE is in a near-term range between $55 and $62. A break below $55 could open the door to a move toward $50, while a reclaim of $62 could signal a return to the token’s previous trading range.
The two charts behind Wedson’s warning come from Alphractal’s liquidation-level model, which estimates where leveraged long and short positions would be forced to close if the price reaches certain levels.
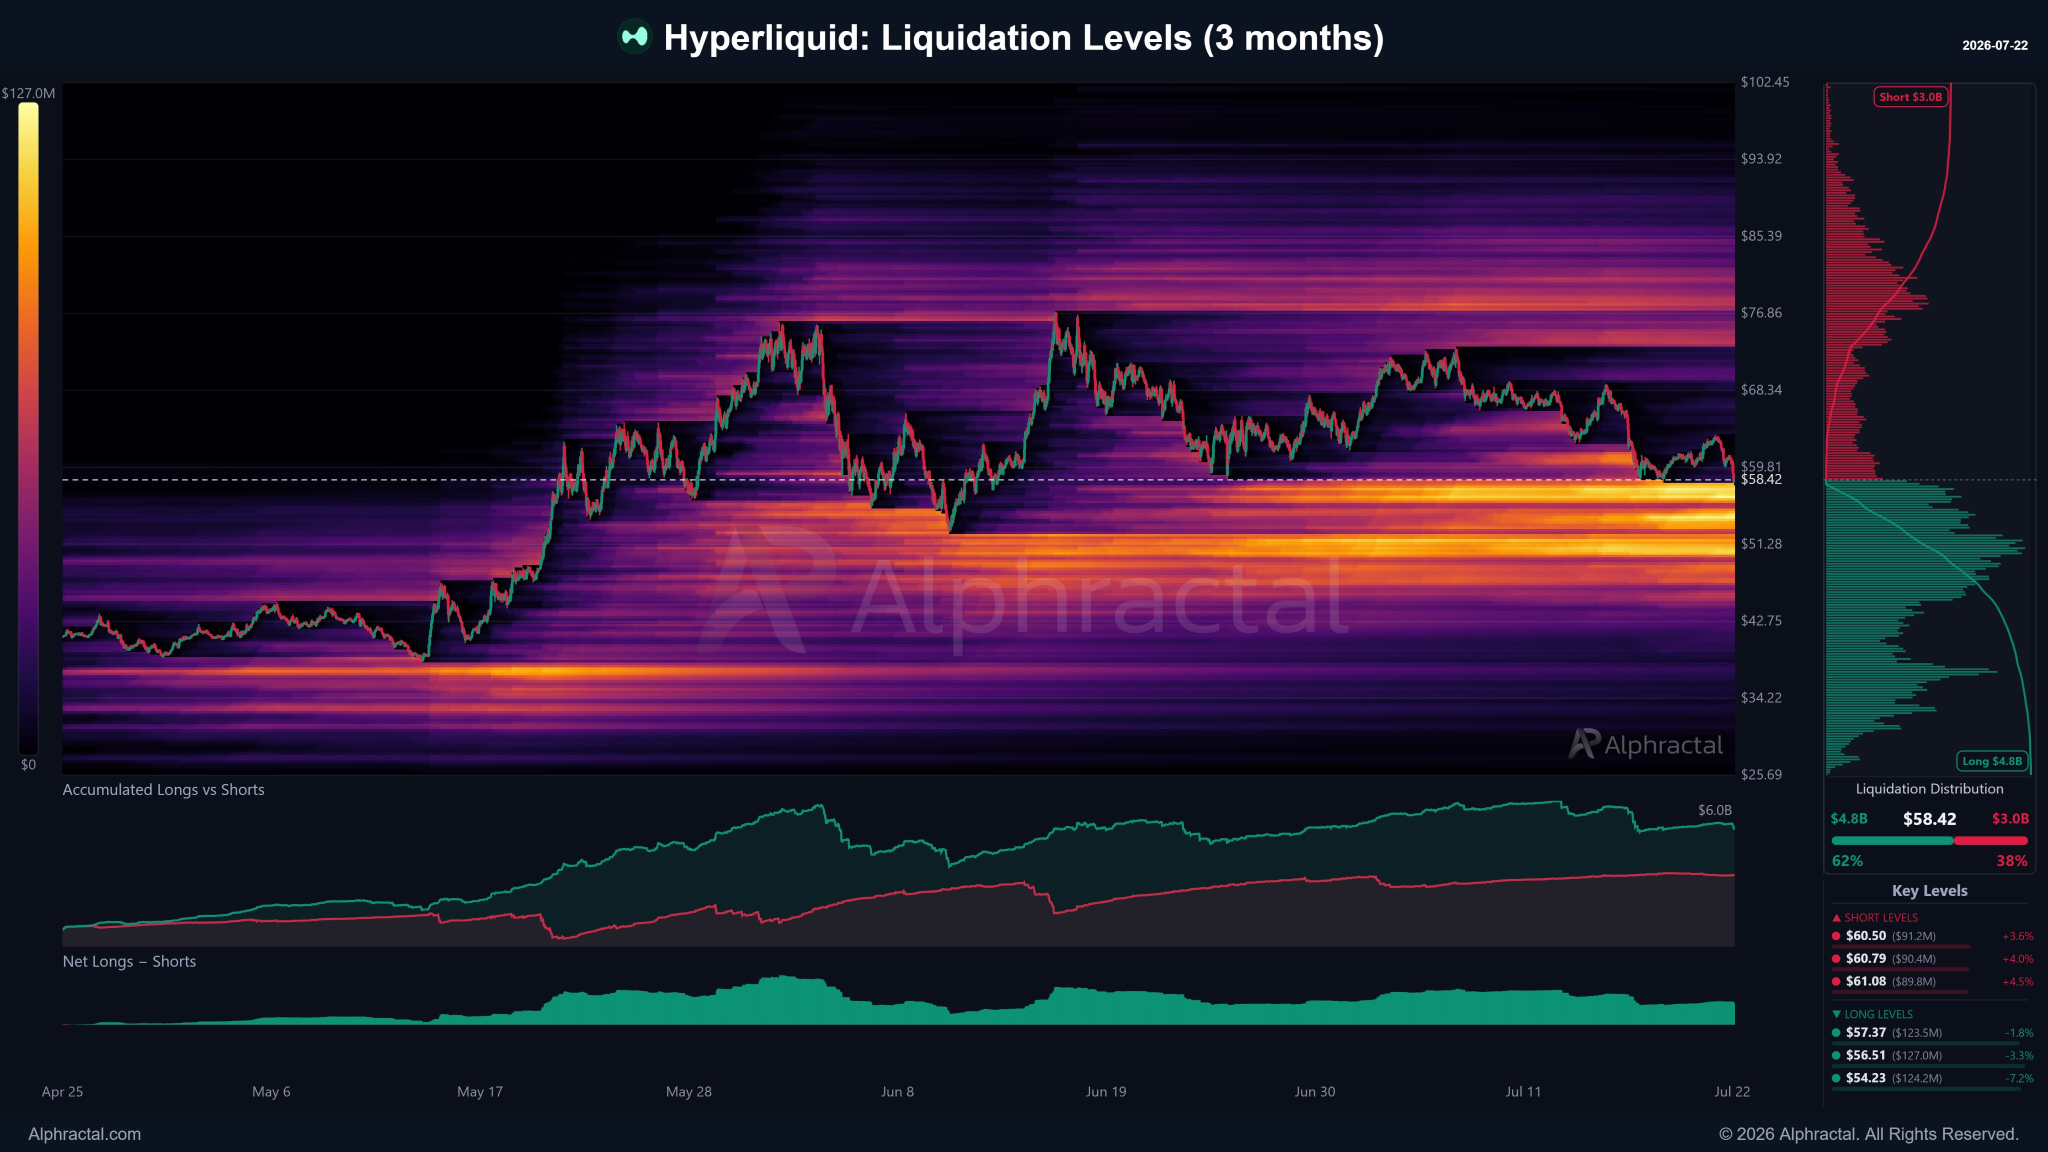
The three-month view shows a market still tilted toward longs. About 62% of tracked liquidation exposure sits on the long side (around $4.8 billion), compared with 38% on the short side (around $3.0 billion).
That’s a meaningful imbalance. It means a price drop has more leveraged positions to “feed on” than a rally does. The chart’s brightest and most concentrated liquidation zone sits just below the current price, in the low-$50s to mid-$50s range, exactly where a cascade of long liquidations would be triggered if HYPE continues to slide.
 Source:
X
Source:
X
Specific long liquidation clusters flagged on the three-month chart include:
- $57.37, about 1.8% below the current price ($123.5 million in exposure)
- $56.51, about 3.3% below the current price ($127.0 million in exposure)
- $54.23, about 7.2% below the current price ($124.2 million in exposure)
On the short side, the nearest clusters sit just overhead:
- $60.50, about 3.6% above the current price ($91.2 million in exposure)
- $60.79, about 4.0% above the current price ($90.4 million in exposure)
- $61.08, about 4.5% above the current price ($89.8 million in exposure)
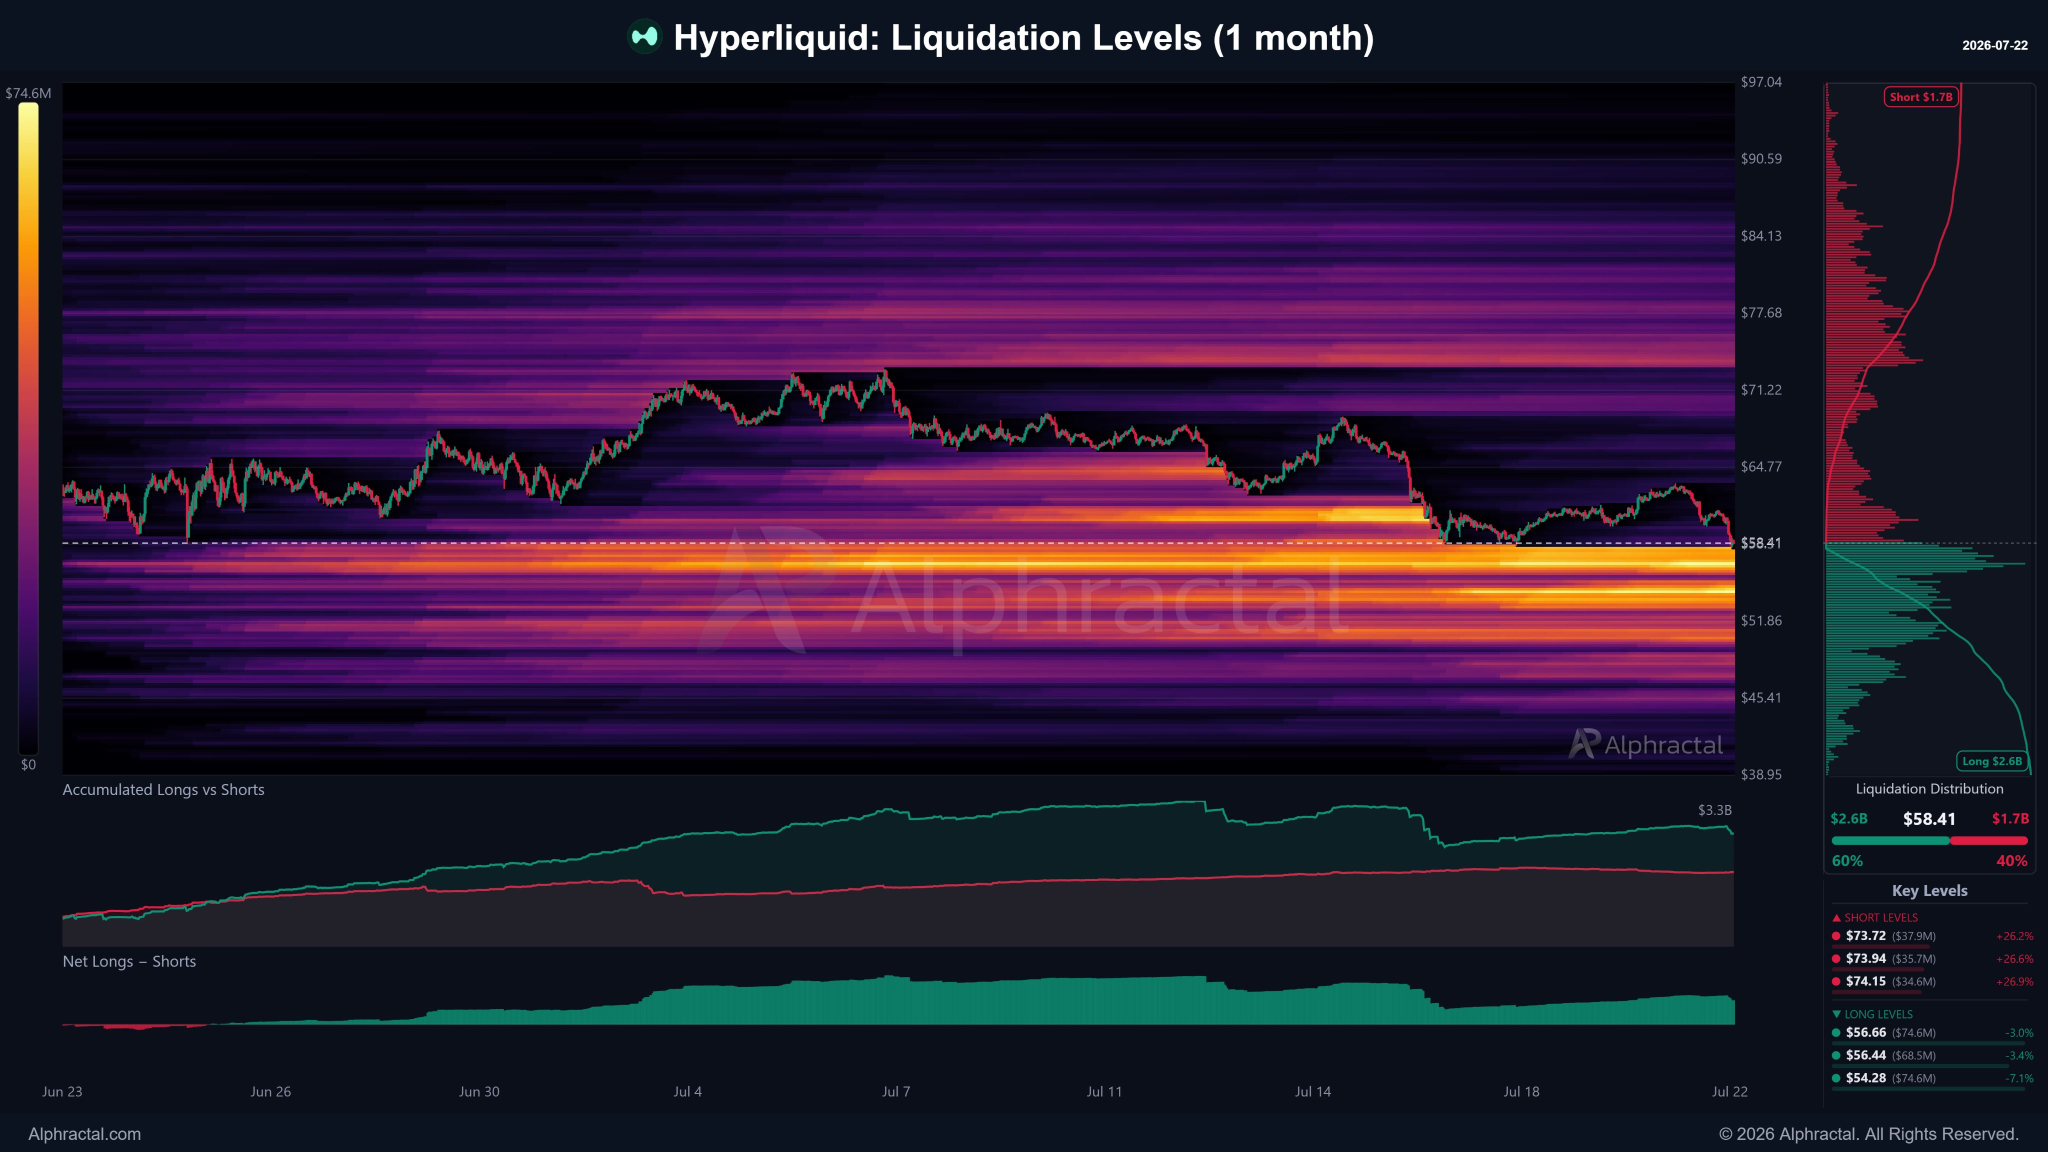
Meanwhile, the one-month view shows the imbalance is slightly less extreme. Around 60% of liquidation exposure is on the long side ($2.6 billion), compared with 40% on the short side ($1.7 billion).
The short liquidation clusters on this shorter timeframe sit much farther away, around $74 (roughly 26-27% above the current price). These are largely positions opened when HYPE was still trading in the $70s.
That gap matters because it suggests that short sellers who entered more recently have much more breathing room than longs, reinforcing the asymmetric risk Wedson is pointing to.
 Source:
X
Source:
X
Wedson views liquidation clusters as price magnets, as markets often move toward areas with the highest concentration of leveraged positions. For HYPE, that suggests downside risk currently outweighs upside risk.
- Longs are more exposed: About two-thirds of liquidation exposure is on the long side, making a break below $57-$58 more likely to trigger a sharp sell-off.
- Key support: The $54-$57 zone contains the largest long liquidation cluster and could accelerate losses if it fails.
- Short squeeze remains possible: A move above $60-$61 could force short covering, sparking a brief rally.
In sum, the liquidation heatmaps highlight where leverage is concentrated, not where the price must go. HYPE’s pullback since its June peak reflects fading momentum and a lack of fresh catalysts.
Related: