
Ubo Stock Falls Below Key Moving Averages With 4.7% Downside Risk

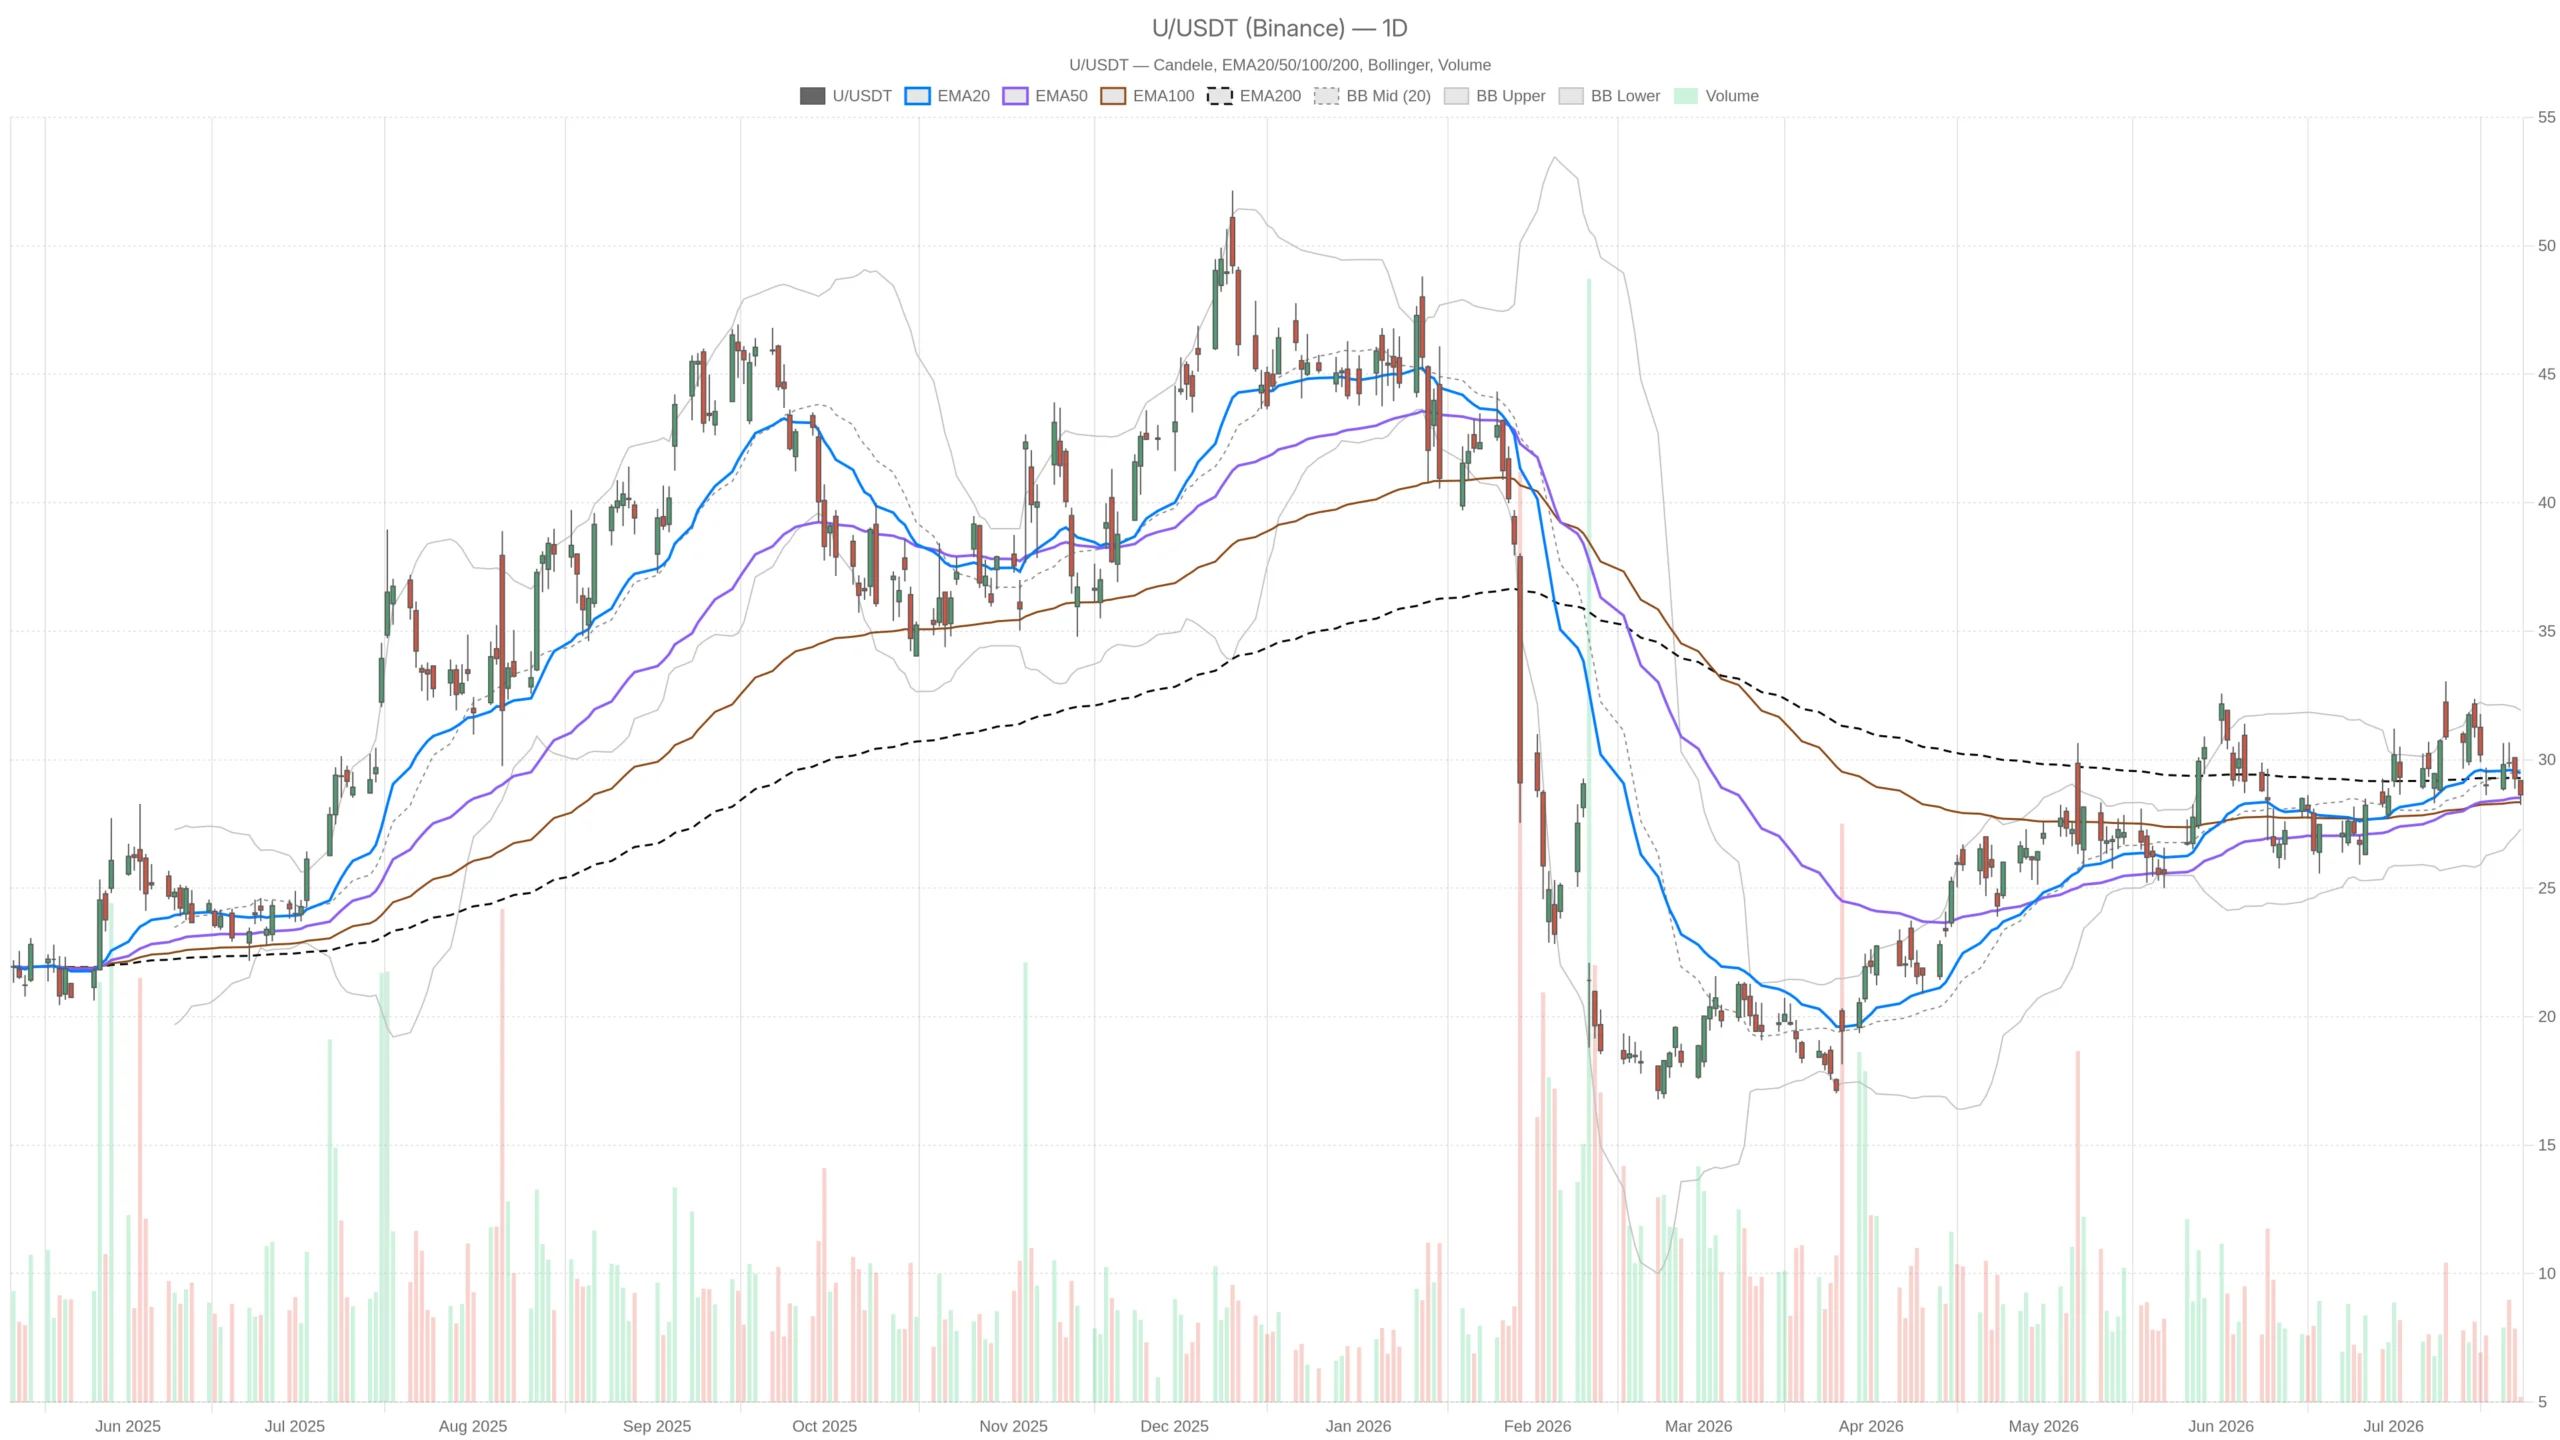 U — daily chart with candlesticks, EMA20/EMA50 and volume.
Summary
- Ubo Stock at a Critical Technical Crossroads
- Key takeaways
- Daily Chart: Neutral Label Masks Bearish Undertone
- Hourly Timeframe Confirms Selling Pressure
- Short-Term Bearish Context on the 15-Minute Chart
- What Ubo Stock Bulls Need to See
- Bearish Scenario and Downside Targets
- Volatility and Positioning Outlook
- FAQ
Ubo Stock at a Critical Technical Crossroads
Ubo stock is trading in an increasingly fragile position, with the weight of evidence leaning bearish across multiple timeframes. The daily regime remains technically neutral, but short-term price structure is deteriorating. Broader macro conditions are also unhelpful.
The session closed at $28.64 after opening at $29.19 — a meaningful intraday rejection. The high matched the open exactly, signaling immediate selling pressure from the first tick. That kind of price behavior rarely reflects buyer conviction. Meanwhile, oil prices surged and the Dow dropped 500 points, weighing on risk assets across the board. This is not a clean directional setup. However, the deterioration deserves attention.
Key takeaways
- Ubo stock closed at $28.64 on July 23, below daily EMA20 ($29.48) and EMA200 ($29.28)
- Daily RSI at 46.47 signals bearish momentum below the 50 midline
- Hourly chart shows price under all three EMAs — a textbook bearish alignment
- Daily EMA50 at $28.52 offers the last line of near-term support
- A break below EMA50 exposes the Bollinger lower band at $27.30, roughly 4.7% downside
Daily Chart: Neutral Label Masks Bearish Undertone
The daily chart carries a neutral regime label, but the underlying indicators tell a more cautious story. Ubo stock sits below both key moving averages, and momentum is steadily fading across multiple readings.
Price Action and Moving Average Alignment
The EMA20 at $29.48 and EMA200 at $29.28 both sit above the current close of $28.64. Price is effectively sandwiched below both averages. One silver lining remains: EMA50 at $28.52 sits below price, offering a thin layer of support. That gap, however, is narrow and could close quickly if selling accelerates.
Bollinger Bands show a midline at $29.61 and a lower band at $27.30. Price is now pressing toward the lower half of that range. The ATR of 1.57 reflects a market that moves with real volatility — this is not a dormant stock. Daily pivots place support at $28.19 and resistance at $29.14.
Momentum Indicators Flash Warning Signals
The daily RSI stands at 46.47 — not yet oversold, but drifting in bearish territory below the 50 midline. Meanwhile, the MACD histogram has turned negative at -0.22. The signal line at 0.58 runs above the MACD line at 0.36. That crossover is a quiet but consistent warning. Momentum is softening steadily.
Hourly Timeframe Confirms Selling Pressure
The 1H chart reinforces the daily concern with sharper clarity. Ubo stock trades below every major EMA on this timeframe, confirming a textbook bearish alignment that leaves little room for bullish interpretation.
EMA Stack and Momentum Breakdown
On the 1H chart, all three EMAs are stacked above price: EMA20 at $29.51, EMA50 at $29.89, and EMA200 at $29.30. Price at $28.61 trades below every single one. That alignment leaves Ubo stock structurally exposed. The hourly RSI has dropped to 33.75, approaching oversold conditions without technically reaching them.
Meanwhile, the hourly MACD confirms the story. The line sits at -0.33, below the signal at -0.25, with a histogram of -0.08. Momentum is negative and still declining. Bollinger Bands on the 1H show price hugging the lower band at $28.64. The midline at $29.72 acts as overhead resistance. That gap of over a dollar suggests recovery would require a meaningful catalyst, not routine buying. Hourly pivots echo the daily structure: support at $28.17, resistance at $29.12.
Short-Term Bearish Context on the 15-Minute Chart
The 15-minute chart is the only timeframe explicitly flagged as bearish in regime classification, and that granularity matters for short-term timing. Ubo stock continues to show weakness at the most immediate level.
The most recent 15m candle shows price closing at $28.64 — right at the Bollinger lower band of $28.63. That proximity to the band floor can trigger a brief technical bounce. However, it is not a reversal signal on its own. The 15m MACD line at -0.20 and signal at -0.17 show negative momentum persisting. RSI at 39.25 mirrors the hourly compression.
Notably, all three 15m EMAs — at $29.05, $29.37, and $29.98 — sit comfortably above price. This reinforces the downtrend across every short-term frame. The 15m ATR of 0.30 tells us intraday moves are tightening slightly, which could indicate brief consolidation before the next directional move.
What Ubo Stock Bulls Need to See
A credible bullish scenario requires a reclaim of the $29.14 resistance level on a closing basis. That level aligns with both daily and hourly R1 pivot points. Breaking it cleanly would signal that buyers are absorbing the overhead supply. A push back above EMA200 at $29.28 on the daily chart would add further weight to any recovery thesis.
The daily EMA50 at $28.52 is the most immediate support. A bounce from this level, combined with an RSI recovery above 50 on the daily frame, could shift the near-term narrative. Overall market stabilization — particularly a pullback in oil prices — would also reduce the macro drag currently pressuring equities broadly.
Bearish Scenario and Downside Targets
On the other hand, a daily close below EMA50 at $28.52 would remove the last meaningful EMA support below current price. From there, the Bollinger lower band at $27.30 becomes the next logical target. That represents roughly 4.7% of additional downside from current levels — not negligible given the ATR of 1.57.
The macro backdrop is not helping. The broader market sold off sharply on July 22 as Brent crude surged above $100 and major tech names fell. Ubo stock is not immune to that environment. If risk-off sentiment deepens, the neutral daily regime could quickly tip toward a confirmed bearish classification. The MACD histogram turning more negative on the daily frame would be the first warning sign to watch.
Volatility and Positioning Outlook
The evidence across timeframes tells a consistent story: Ubo stock is under pressure, momentum is fading, and the macro environment is unhelpful. The daily regime remains technically neutral, but only just. The hourly and 15-minute frames are already leaning bearish.
The full EMA stack sitting above price on all three timeframes is a structural concern that cannot be dismissed. At the same time, the proximity of daily EMA50 support and an RSI not yet deeply oversold suggests the situation has not fully resolved. Volatility remains real — daily ATR of 1.57 means meaningful swings are possible in either direction.
Therefore, patience and confirmation are key. A clean break in either direction, supported by volume and momentum follow-through, will define the next meaningful leg for Ubo stock.
FAQ
What is the current price of Ubo stock and why is it under pressure?
Ubo stock closed at $28.64 on July 23, 2026, below both the daily EMA20 ($29.48) and EMA200 ($29.28). The stock is under pressure from deteriorating technical momentum and broader macro headwinds, including surging oil prices and a 500-point drop in the Dow.
What are the key support and resistance levels for Ubo stock?
Key support sits at the daily EMA50 of $28.52, followed by the Bollinger lower band at $27.30. On the resistance side, $29.14 represents the immediate hurdle, aligning with both daily and hourly R1 pivot points. The EMA200 at $29.28 adds a secondary layer of overhead resistance.
Is the outlook for Ubo stock bullish or bearish?
The daily regime remains technically neutral, but the weight of evidence leans bearish. The hourly and 15-minute timeframes are already showing bearish structures, with price below all major EMAs on multiple timeframes. A break in either direction, confirmed by volume and momentum, will define the next meaningful move.
{"@context":"https://schema.org","@type":"FAQPage","mainEntity":[{"@type":"Question","name":"What is the current price of Ubo stock and why is it under pressure?","acceptedAnswer":{"@type":"Answer","text":"Ubo stock closed at $28.64 on July 23, 2026, below both the daily EMA20 ($29.48) and EMA200 ($29.28). The stock is under pressure from deteriorating technical momentum and broader macro headwinds, including surging oil prices and a 500-point drop in the Dow."}},{"@type":"Question","name":"What are the key support and resistance levels for Ubo stock?","acceptedAnswer":{"@type":"Answer","text":"Key support sits at the daily EMA50 of $28.52, followed by the Bollinger lower band at $27.30. On the resistance side, $29.14 represents the immediate hurdle, aligning with both daily and hourly R1 pivot points. The EMA200 at $29.28 adds a secondary layer of overhead resistance."}},{"@type":"Question","name":"Is the outlook for Ubo stock bullish or bearish?","acceptedAnswer":{"@type":"Answer","text":"The daily regime remains technically neutral, but the weight of evidence leans bearish. The hourly and 15-minute timeframes are already showing bearish structures, with price below all major EMAs on multiple timeframes. A break in either direction, confirmed by volume and momentum, will define the next meaningful move."}}]}
Article produced with the assistance of artificial intelligence and reviewed by the editorial team.
Disclaimer: The content of this article solely reflects the author's opinion and does not represent the platform in any capacity. This article is not intended to serve as a reference for making investment decisions.
You may also like
Silver rallies 1.4% to $65 as bulls target $66 after US CPI data
PEPE Price Prediction: Bulls Eye a Fresh Rally as Momentum Builds

All Eyes on Walsh: Will the "Central Bank Super Week" See a G7 Rate Hike Wave Next Week?
Amid rising inflation, geopolitical conflicts, and oil prices surpassing $100, G7 central banks are entering a crucial rate-setting week. Driven by higher-than-expected core inflation, the Federal Reserve is expected to implement its first rate hike in three years; the Bank of Japan is likely to raise rates to 1.25%, marking a 30-year high; meanwhile, the Bank of England, the European Central Bank, and the Bank of Canada are also reinforcing their hawkish stances. Global monetary policy is undergoing a major turnaround towards collective tightening.
Uniswap processes $70.6 billion in 30-day DEX trades, outpacing rivals
Crypto prices
More


