
Silver Price Forecast: XAG/USD gains even as oil prices rebound, Fed policy awaited

Silver price (XAG/USD) trades 1.14% higher to near $57.80 during the Asian trading session on Wednesday. The white metal gains even as oil prices rebound strongly due to renewed conflicts between the United States (US) and Iran.
At press time, the WTI Oil price is up 3.65% to near $81.20, snapping a three-day losing streak.
The US Central Command (CENTCOM) reported late Tuesday that it intercepted all ballistic missiles launched by Iranian Islamic Revolutionary Guard Corps (IRGC) forces. In retaliation, CENTCOM reported carrying out precision strikes in Iraq, targeting Iran-backed groups planning attacks on US forces and Saudi oil facilities.
The Silver price has underperformed in the past months as higher oil prices boost inflation expectations, a scenario that forces global central banks to lean towards higher or steady interest rates.
Theoretically, higher interest rates by central banks bode poorly for non-yielding assets, such as Silver.
Meanwhile, investors await the Federal Reserve’s (Fed) monetary policy announcement at 18:00 GMT. According to the CME FedWatch tool, traders see a 69.5% chance that the Fed will leave interest rates unchanged in the range of 3.50%-3.75%. This will be the fifth straight policy meeting when the Fed will maintain the status quo.
Investors should not expect any remarks from the Fed regarding the monetary policy guidance, as Chairman Kevin Warsh explicitly said in the previous meeting that “so-called forward guidance is not well-suited in the current policy juncture”.
Silver technical analysis
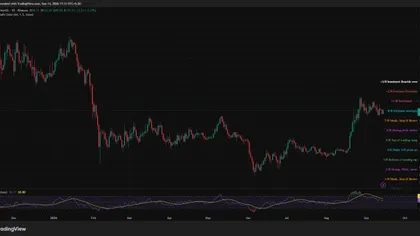
XAG/USD trades higher at around $57.63 at press time, but is keeping a bearish near-term tone as it holds below the 20-day Exponential Moving Average (EMA), which is at roughly $58.93.
The fact that price remains capped by this short-term EMA suggests rallies are being sold into, while the Relative Strength Index (RSI) around 43 stays below the neutral 50 line, hinting that downside pressure still dominates even if conditions are not oversold.
On the topside, initial resistance is defined by the 20-day EMA near $58.93, and a daily close above this barrier would be needed to ease the current downside bias and open room for a further rebound towards $60.00. Looking down, the July 17 low at $54.77 is the key support zone.
Disclaimer: The content of this article solely reflects the author's opinion and does not represent the platform in any capacity. This article is not intended to serve as a reference for making investment decisions.
You may also like
Solana price holds $100 as it nears symmetrical triangle breakout
Up 200%: Shiba Inu (SHIB) Crosses Billion in Average Exchange Inflows

After the closure of the key bypass pipeline, Saudi Arabia is reportedly seeking to increase crude oil exports via the Strait of Hormuz
After last week's attack in Saudi Arabia, the east-west oil pipeline—with a previous maximum daily crude oil transport capacity of 5 million barrels—was shut down. The U.S. Energy Secretary stated he expects the pipeline to resume operations soon, but regional officials said recovery may take several weeks. Saudi Arabia’s crude oil exports dropped to 3 million barrels per day in August, the lowest in at least nine years, but increased in September. Iran claimed it postponed a meeting regarding Hormuz shipping, originally scheduled for this Monday, at Saudi Arabia’s request. Trump stated that Iran is eager and urgently needs to reach a deal; he will decide if the U.S. will participate, and that the U.S. remains open to the discussion.
Sidney Brewer urges XRP holders to leverage tokens, avoid large sales
Crypto prices
More


