Ethereum faced renewed downside volatility after failing to hold the $1.9K support level.
The altcoin subsequently fell to $1,848, a level last seen two weeks ago. At press time, ETH traded near $1,865, down 1.9% daily.
Although Ethereum’s upside momentum remained weak, institutional activity suggested that some large investors were still optimistic.
Why did Fidelity move $499M in ETH?
However, the transfers did not indicate an intention to sell. Instead, the movement suggested internal custody rebalancing.
Such transfers often attract market attention but generally have a neutral effect on prices.
Is Bitmine still buying Ethereum?
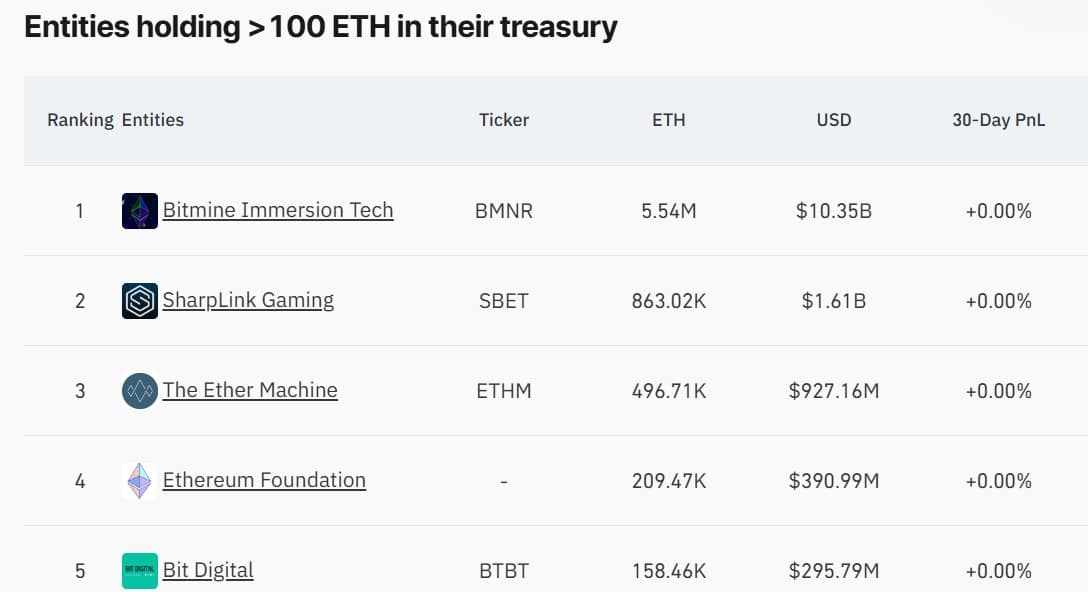
While Ethereum remained in a prolonged downtrend, several treasury companies halted accumulation or reduced their holdings.
For example, SharpLink Gaming, the second-largest corporate holder, had not purchased ETH since October 2025.
The company reduced its exposure as unrealized losses exceeded $1.4 billion. By contrast, Bitmine continued accumulating.
That demand coincided with persistent exchange outflows. Ethereum’s [ETH] Exchange Netflow remained negative for six consecutive days. At press time, Exchange Netflow stood near -3,200 ETH, indicating continued withdrawals from trading platforms.
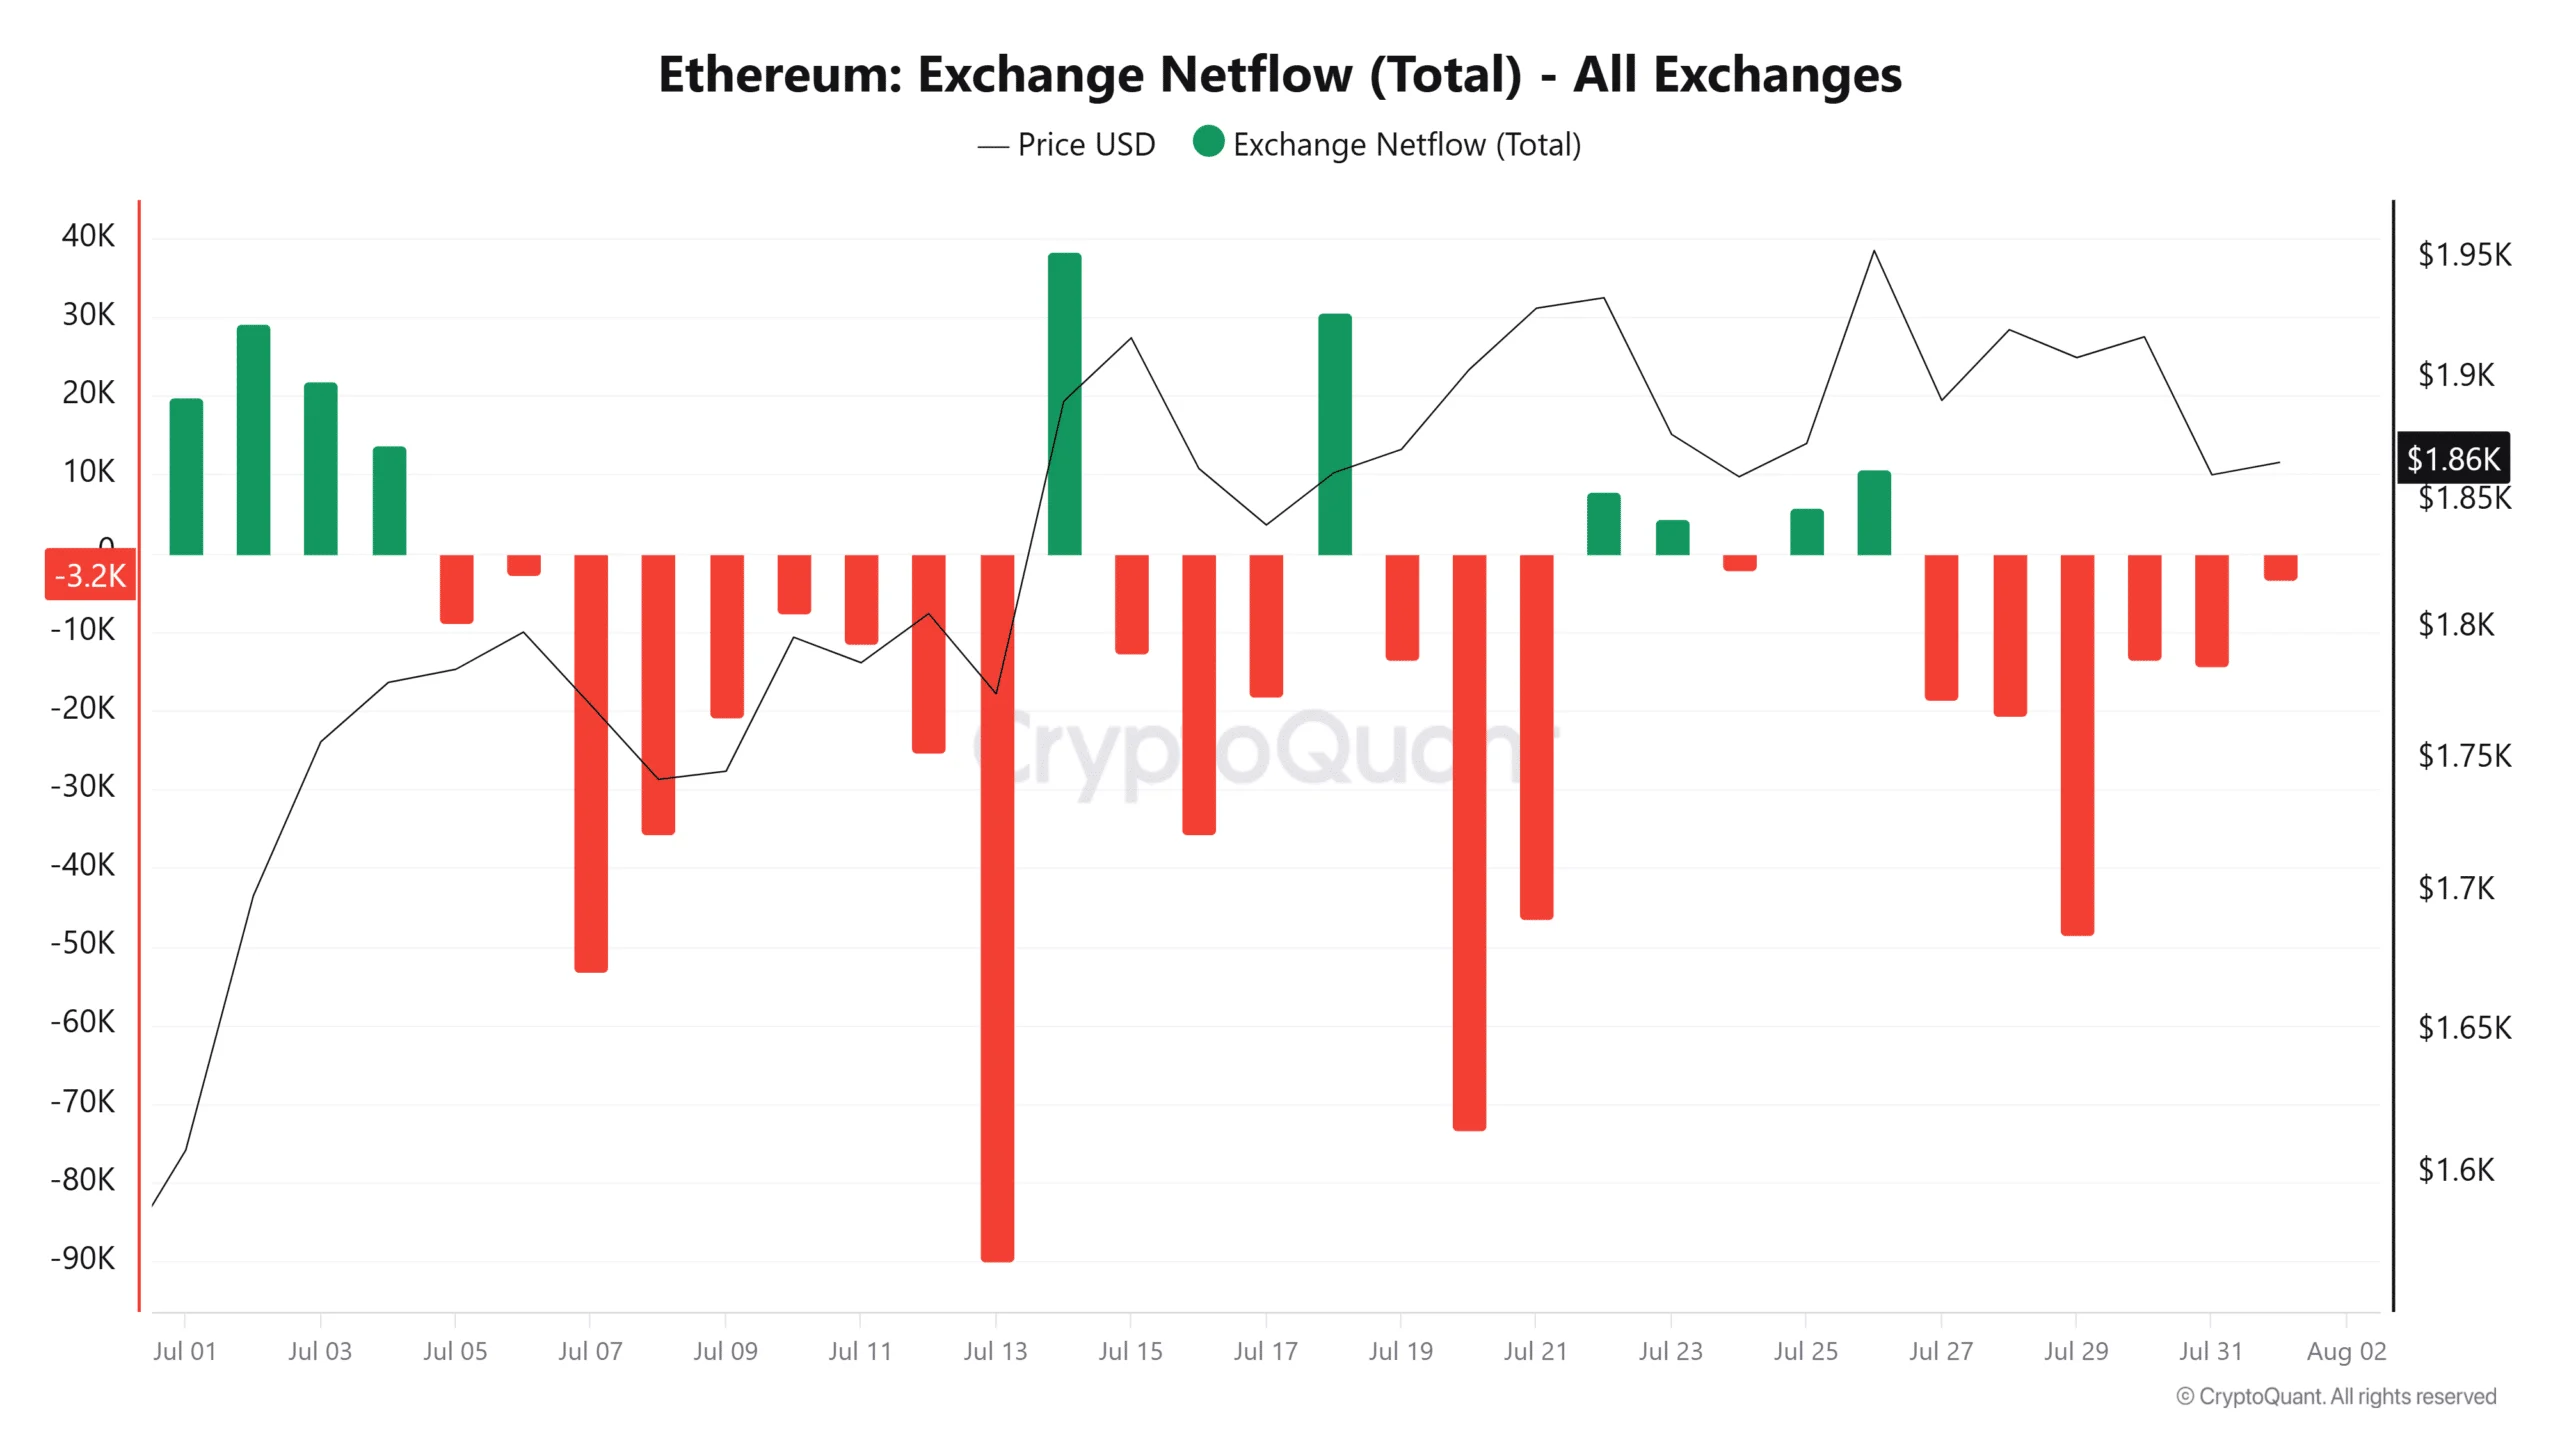
The last similar outflow period occurred in early July. ETH then climbed from $1.7K to $1.9K. If demand persists, Ethereum could recover from its latest decline.
Can ETH recover in August?
Despite declining exchange supply, Ethereum’s short-term momentum remained weak.
ETH traded below its 20-day Moving Average, while the MACD-SMA indicator reflected continued seller control. The Bulls v Bears indicator also formed a bearish crossover, reinforcing the possibility of further short-term pressure.
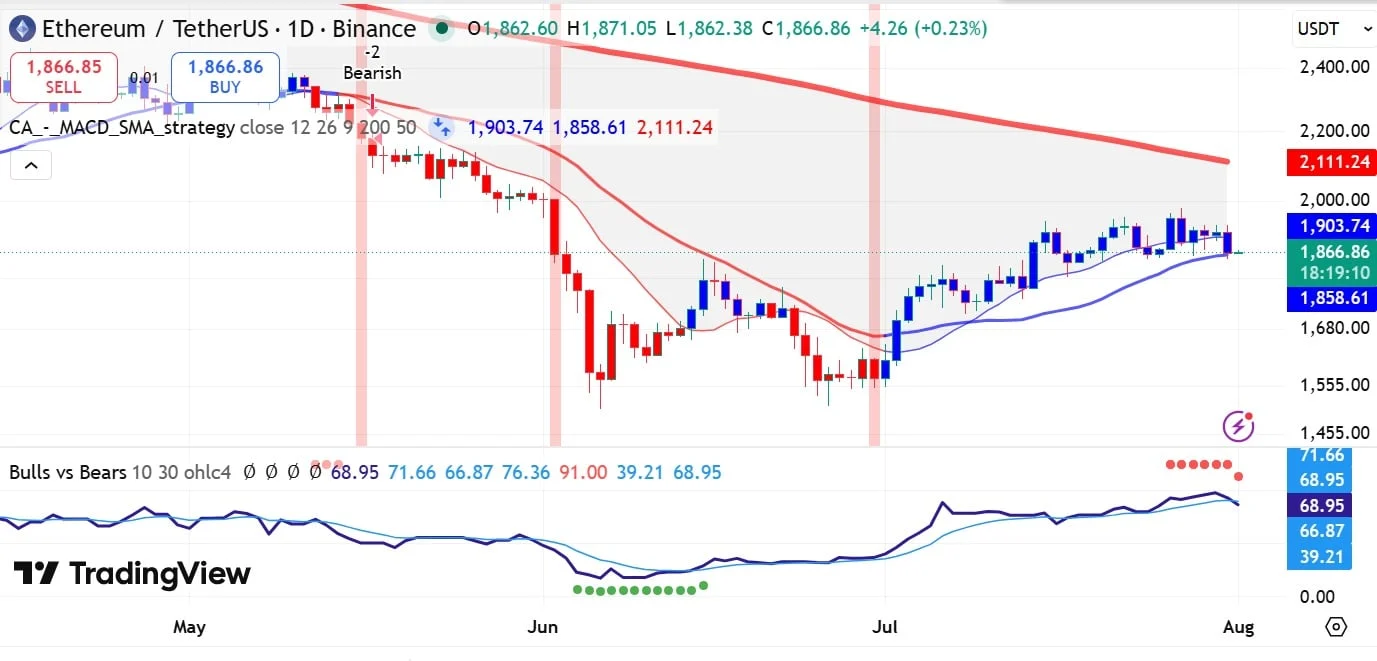
If this weakness persists, ETH could fall below $1.8K, placing the next support level near $1,750.
However, ETH remained above its 200-day Moving Average. This suggested that the broader market structure was still bullish.
Sustained demand from Bitmine could help ETH defend its 50-day Moving Average and reclaim its 20-day Moving Average. Under that scenario, Ethereum could retest $1,950 before targeting a move above $2,000.
Final Summary
- Fidelity-linked wallets transferred $499.55 million in ETH, likely reflecting internal custody rebalancing.
- Bitmine accumulated another $19.48 million despite Ethereum’s prolonged price decline.