

 invezz.com
Aave ($AAVE) could decline by another 45% toward $50 if its latest rebound fails to overcome a resistance level that has contained the token for nearly a year.
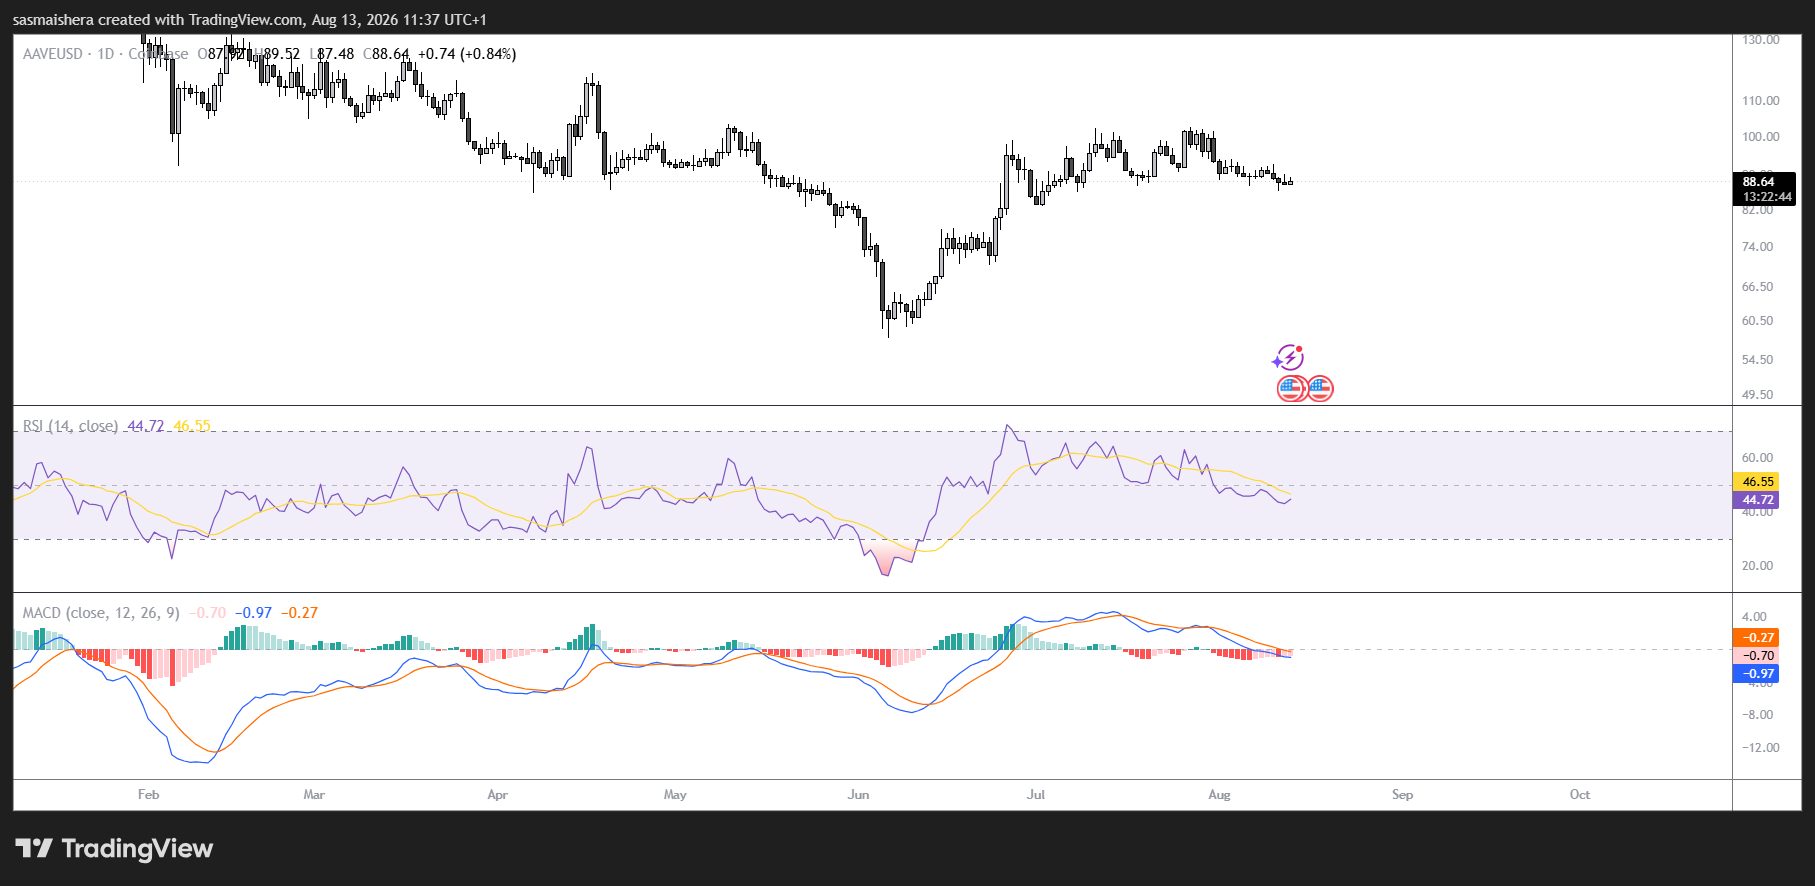
$AAVE is trading near $89 on Thursday, below its 20-week Exponential Moving Average (EMA) at approximately $96.70.
This moving average has served as resistance since October 2025, with repeated attempts to reclaim it failing to establish sustained support.
Although the downside risk remains substantial, a return to $50 could also present a historically significant accumulation opportunity for long-term investors.
$AAVE struggles below the 20-week EMA
$AAVE recently recovered from around $60 and briefly approached its 20-week EMA. However, the subsequent pullback showed that buyers were not strong enough to break the long-standing resistance.
The rejection keeps the token’s broader bearish structure intact. Until $AAVE records a decisive weekly close above the 20-week EMA and successfully retests it as support, rallies may remain vulnerable to renewed selling.
The $96.70 area is therefore the immediate level that could determine $AAVE’s next major move.
If $AAVE remains below its 20-week EMA, the price could retreat toward the next major long-term support zone between $49.50 and $50.
This region corresponds with the 1.0 Fibonacci retracement level. A decline from $89 to $50 would represent a loss of approximately 44% to 45%.
The $50 area also has historical significance. $AAVE repeatedly attracted buying interest around similar levels between 2022 and 2023 before eventually recovering toward $400.
If the price revisits this zone, long-term investors could once again treat it as an accumulation area.
However, previous support does not guarantee that buyers will defend the level during another test.
A decisive breakdown below $50 would invalidate the accumulation argument and risk extending the broader downtrend.
A break above $96.70 could weaken the bearish outlook
The bearish scenario would begin to lose credibility if $AAVE decisively reclaims the 20-week EMA and converts it into support.
Such a breakout could send the token toward the $105–$125 region, which contains previous horizontal resistance.
A move above this range would improve $AAVE’s technical structure and indicate that buyers are regaining control after months of failed recovery attempts.
However, the token would still face several major resistance levels before confirming a long-term trend reversal.
$AAVE’s weekly chart may be developing an inverse head-and-shoulders pattern, a formation typically associated with a bullish reversal.
The structure includes a left shoulder around the recent lows, a deeper head near $60, and a potential right shoulder forming around the current price. The neckline appears near $105.
A convincing breakout above the neckline could confirm the pattern and produce a technical target near $200.
Still, $AAVE would first need to reclaim the 20-week EMA and overcome the wider $105–$125 resistance area. Without those moves, the potential reversal pattern remains unconfirmed.
Even if $AAVE breaks above the inverse head-and-shoulders neckline, several long-term moving averages could slow its recovery.
The 50-week EMA stands near $131, while the 100-week EMA is around $153. The 200-week EMA provides another significant barrier near $167.
These levels form a dense resistance cluster between $AAVE’s current price and the potential $200 target.
Reclaiming the 50-, 100- and 200-week EMAs would provide stronger evidence that the token’s long-term downtrend is ending. Failure to clear them could lead to fresh pullbacks even after a breakout above $105.
For now, $AAVE remains at a critical point. A sustained move above $96.70 would improve the outlook, while continued rejection could expose the historically important $50 support zone.


