
XRP Flashes Historic Overbought Signal as Ripple Price Today Holds $1.38

As of August 21, 2026, XRP trades at $1.38, leaving Ripple price today in an uncomfortable technical spot. The daily RSI sits at 82.82, deep in overbought territory, while price trades clean through the upper Bollinger Band at 1.25.
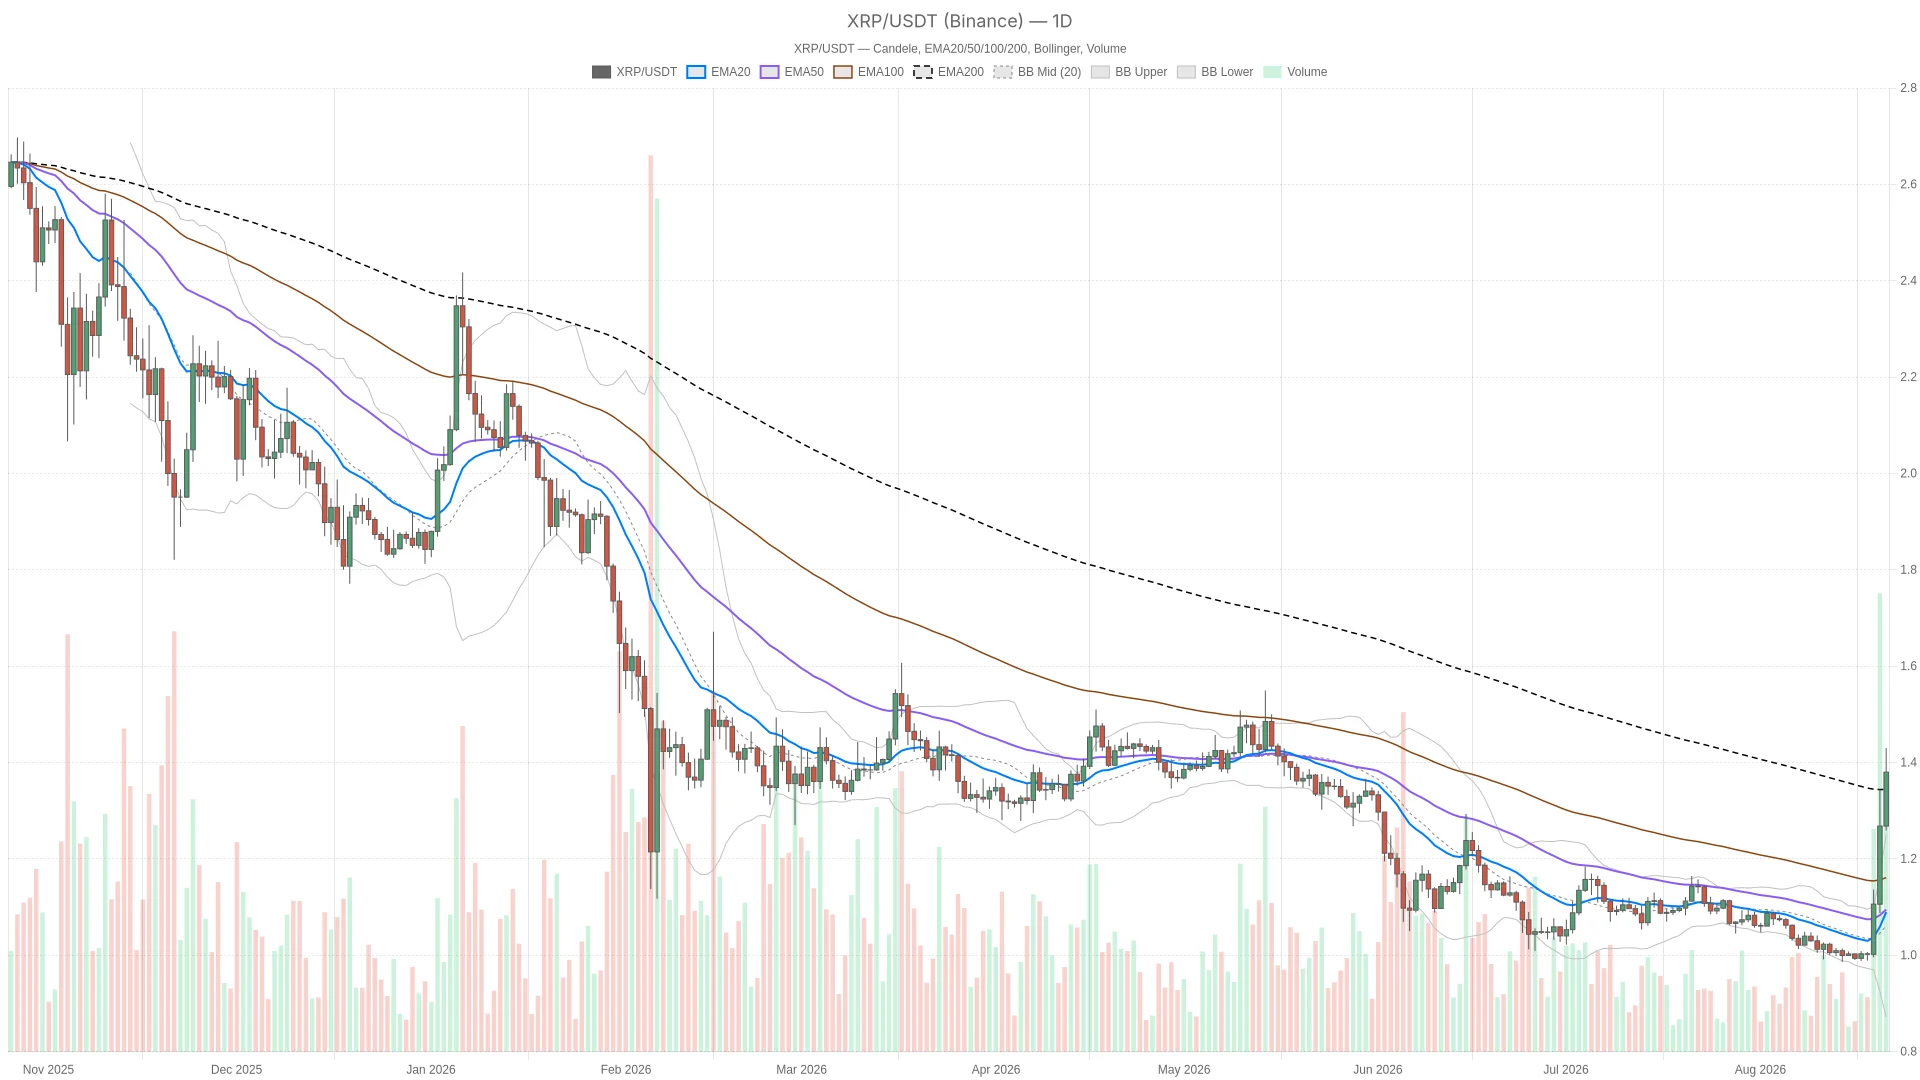 XRP/USDT — daily chart with candlesticks, EMA20/EMA50 and volume.
Summary
Key takeaways
- XRP trades at $1.38 on August 21, 2026, with the daily RSI pinned at 82.82.
- Price sits above the upper daily Bollinger Band at 1.25, roughly 27% above the 20-day and 50-day EMAs near 1.09.
- Total crypto market capitalization rose 3.62% in 24 hours to about $2.6 trillion, with the Fear & Greed Index at 72.
- The daily pivot sits at 1.36, with resistance at 1.45 and support at 1.28.
- The hourly chart remains bullish, with EMA20 at 1.3, EMA50 at 1.21 and EMA200 at 1.08.
A Market Caught Between Momentum and Mean Reversion
Extension, not trend-following, defines the daily setup. For Ripple price today, the move has been sharp and fast rather than a slow grind. Price at 1.38 runs roughly 27% above the 20-day and 50-day EMAs, which overlap near 1.09.
The 200-day EMA at 1.34 remains below spot, so the longer-term uptrend structure is technically intact. However, the gap between short-term EMAs and price rarely resolves cleanly higher without at least a pause. Interestingly, the system still tags the daily regime as neutral rather than bullish. That label reflects momentum that has run so far and so fast that it is borderline unsustainable in its current form. Even so, the trend itself has not broken.
Daily Chart: The Macro Bias
The daily chart still shows constructive momentum, but buyers have stretched the pace beyond normal band structure. MACD remains positive, with the line at 0.03 above the signal at -0.01 and a histogram of 0.04.
However, an RSI above 82 paired with price trading above the upper Bollinger Band at 1.25 tells a different story. This is a market where buyers are clearly in control, but the pace has outrun what band structure considers normal. The daily pivot sits at 1.36, with resistance at 1.45 and support at 1.28.
Moreover, price holding above the pivot keeps the near-term bias tilted higher, and a push through 1.45 would confirm continuation. Daily ATR of 0.06 sets the volatility band traders should expect session to session. It is not enormous, but it is enough to produce real swings around these pivot levels.
1H Confirmation: Bullish Structure, Cooling Pace
The hourly chart confirms the bullish bias with cleaner structure than the daily, but intraday momentum is cooling. EMA20 at 1.3, EMA50 at 1.21 and EMA200 at 1.08 stack in proper bullish order, and the regime reads bullish outright.
Notably, RSI at 69.85 is elevated but not extreme, a healthier reading than the daily’s 82.82. It suggests intraday buyers are active without being fully exhausted yet. MACD is still positive, but the histogram has thinned to just 0.01, hinting that upside momentum is decelerating even as the trend holds.
Meanwhile, price trades close to the upper Bollinger Band at 1.4 and right around the hourly pivot at 1.39. Resistance sits at 1.41 and support at 1.36. This tight range shows the market pausing to digest the recent move rather than aggressively rejecting it.
15-Minute View: Execution Context
The 15-minute chart confirms a bullish but directionless pause right at spot. RSI has cooled to 60.08, and the MACD histogram is essentially flat at 0, which fits a market taking a breather rather than reversing.
Meanwhile, EMAs remain bullishly stacked at 1.36, 1.32 and 1.20, while the pivot, R1 and S1 have all converged at 1.38. This signals tight, low-decision-range consolidation right at spot. For entries on this timeframe, short-term structure is bullish but directionless, waiting for the daily or hourly picture to resolve first.
Bullish Scenario
The bullish case stays open if XRP holds above the daily pivot at 1.36 and the hourly pivot at 1.39. Broader risk appetite, shown by the 3.62% 24-hour market cap gain and the Greed reading of 72, continues to support altcoins. That keeps the path toward R1 at 1.45 open.
Additionally, a clean break and hold above 1.41, the hourly R1, with the MACD histogram re-expanding would be the strongest confirmation. It would show momentum resuming rather than fading. This scenario would fail if price cannot reclaim 1.39 and rolls back below the hourly EMA50 at 1.21. That would flip intraday structure from constructive to defensive.
Bearish Scenario
The bearish case rests on the daily overextension, which raises the odds of a mean-reversion move. An RSI above 82 combined with price trading outside the upper Bollinger Band has historically marked an unstable state. It does not guarantee a reversal, but it lifts the odds of a move back toward the band’s midline at 1.06. Alternatively, price could drift toward the daily EMA200 at 1.34.
Meanwhile, a break below daily support at 1.28 would be the clearest signal that the stretch is unwinding. That would open room toward the EMA20/50 cluster near 1.09. This bearish read would fail if XRP consolidates sideways above 1.36. That would let the EMAs catch up to price instead of correcting sharply, keeping the broader uptrend alive.
Positioning and Risk
The honest read is that the trend is up, but the pace is fragile. The daily and hourly charts agree on direction but disagree on how much room is left before this move cools off. The daily is flashing exhaustion signals the hourly has not caught up to yet.
Meanwhile, with daily ATR at 0.06 and hourly ATR at 0.03, traders should expect near-term swings around the 1.36-1.45 zone. This holds regardless of which scenario plays out. A Fear & Greed reading of 72 adds another layer of caution. Sentiment this stretched can persist longer than expected in a strong tape, but it also leaves less room for disappointment.
This is a market environment that rewards patience over conviction. Waiting for either a decisive break through resistance or a clean reset toward support offers a clearer read. This beats trying to call the top or bottom of an already extended move.
FAQ
How overbought is XRP right now?
The daily RSI sits at 82.82, deep in extreme overbought territory, while price trades above the upper daily Bollinger Band at 1.25. That combination has historically been an unstable state.
What are the key support and resistance levels for XRP?
The daily pivot sits at 1.36, with resistance at 1.45 and support at 1.28. On the hourly chart, resistance sits at 1.41 and support at 1.36.
What would invalidate the bullish scenario?
A failure to reclaim 1.39 and a roll back below the hourly EMA50 at 1.21 would flip intraday structure from constructive to defensive.
{"@context":"https://schema.org","@type":"FAQPage","mainEntity":[{"@type":"Question","name":"How overbought is XRP right now?","acceptedAnswer":{"@type":"Answer","text":"The daily RSI sits at 82.82, deep in extreme overbought territory, while price trades above the upper daily Bollinger Band at 1.25. That combination has historically been an unstable state."}},{"@type":"Question","name":"What are the key support and resistance levels for XRP?","acceptedAnswer":{"@type":"Answer","text":"The daily pivot sits at 1.36, with resistance at 1.45 and support at 1.28. On the hourly chart, resistance sits at 1.41 and support at 1.36."}},{"@type":"Question","name":"What would invalidate the bullish scenario?","acceptedAnswer":{"@type":"Answer","text":"A failure to reclaim 1.39 and a roll back below the hourly EMA50 at 1.21 would flip intraday structure from constructive to defensive."}}]}
Article produced with the assistance of artificial intelligence and reviewed by the editorial team.
Disclaimer: The content of this article solely reflects the author's opinion and does not represent the platform in any capacity. This article is not intended to serve as a reference for making investment decisions.
You may also like
Trump presses the Federal Reserve to "cut rates to save the economy," but the market is betting on a 60% probability of a rate hike in September
Ahead of the Federal Reserve’s September monetary policy meeting (scheduled for September 15-16), U.S. President Trump and senior administration officials have made intensive statements, urging the central bank not to raise interest rates and even calling for a cut in the benchmark rate.

US energy stocks remain "cheap" after surging: High oil prices may lead to a valuation recovery
The Energy Select Sector SPDR ETF, which tracks US energy stocks, has surged over 43% year-to-date, far outperforming other S&P 500 sectors. Despite this, the energy sector remains one of the lowest-valued sectors within the S&P 500. High oil prices have led to excess profits for energy stocks; although Wall Street previously viewed this round of earnings growth as a temporary phenomenon, if elevated oil prices persist longer than expected, the valuation recovery of energy stocks may have only just begun.
Apple ties $119 Quest blood panel to new Health Age score
Besant brings Peashooter to tank battle, US Treasury repo hits a wall, 10-year US Treasury yield at three-year high
U.S. Treasury bonds are currently facing multiple pressures, including high oil prices intensifying inflation, rising expectations of Federal Reserve rate hikes, soaring fiscal deficits, and large-scale corporate bond issuances. At the same time, the $6 billion buyback scale has fallen short of market expectations. While Bessent had previously made lowering long-term yields a policy goal, on Tuesday he admitted that it's impossible to change the "equilibrium" price of government bonds. Analysts pointed out that buybacks cannot stop the fundamentals-driven yield trends, likening it to "the Treasury bringing a pea shooter to a tank battle."
Crypto prices
More


