
Ethereum’s Price Targets $2,920 as $2,438 Floor Key to September Breakout

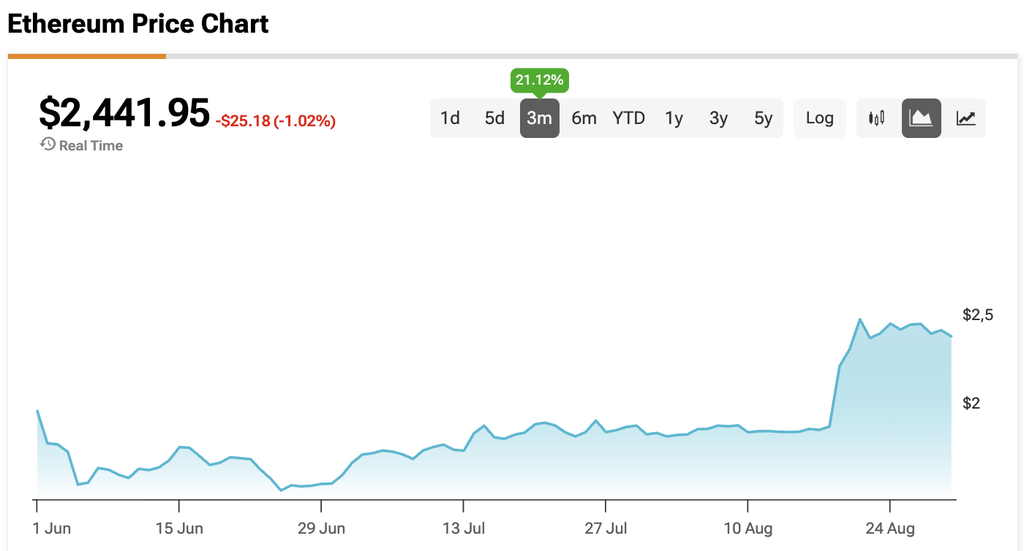
Ethereum (ETH-USD) enters September trading near $2,452 after breaking out of a long-term downward channel. A massive 31% weekly candle two weeks ago established the first higher high of the current market cycle. That surge pushed prices above a descending trendline that had capped every rally since the August 2025 peak at $4,958.
The move places Ethereum right at the 0.618 Fibonacci retracement level of $2,438.85. Holding above this price point keeps the $2,919.89 resistance target in play, which sits roughly 19% higher. However, if sellers push prices below $2,438, Ethereum could retest lower demand zones between $1,600 and $1,760 that previously absorbed a lot of selling in 2023 and 2025.
ETH Is Facing Resistance at $2,550
Despite the recent breakout, short-term resistance continues to limit ETH’s upside progress. Ethereum failed to clear $2,550 on its latest attempt, a level that aligns directly with the 50-week moving average at $2,542. This rejection suggests price action could move sideways or experience a brief dip before starting a sustained trend reversal, making $2,200 key downside support and $2,800 major resistance.
Promotion
55% Off TipRanks
- Unlock powerful investing tools with TipRanks Premium to make smarter, more confident investment decisions
- Subscribe to TipRanks Smart Investor Newsletter, and discover new investing opportunities with data-backed stock picks
Leveraged trading positions add extra risk to this choppy outlook. A large trader recently opened a 10x leveraged long position worth $102.3 million, facing liquidation if Ethereum drops to $2,241. At the same time, several trading firms hold large short positions, setting up potential price volatility as both sides defend their levels.
Ethereum’s Price Could Target $2,920 in September
Daily price charts confirm that volume spiked between August 19 and August 21 as Ethereum cleared its April high near $2,400. That former resistance area now serves as solid downside support alongside the $2,438 Fibonacci mark. Additionally, the Supertrend technical indicator flipped bullish in July and currently provides a lower safety floor near $2,220.
While daily trading volume cooled after the initial surge, institutional buying helped absorb selling pressure. If Ethereum holds the $2,438 floor through September, chart patterns point toward a run at $2,920. Conversely, a drop below $2,438 opens the door to $2,220, with the psychological $2,000 level standing as the ultimate downside defense.
At the time of writing, ETH’s price is sitting around $2,442.
Disclaimer: The content of this article solely reflects the author's opinion and does not represent the platform in any capacity. This article is not intended to serve as a reference for making investment decisions.
You may also like
Evropi Holdings moves H1 2026 results publication to Sept. 17 from Sept. 23
United States Oil Fund On Pace For Highest Close Since June 2015 -- Data Talk
Navan Down Nearly 20%, on Pace for Record Percent Decrease -- Data Talk
Atrys Health maintains 2026 guidance, targets revenue of €156.5 million
Crypto prices
More


