
A chart of commodity support and resistance: gold, silver, oil, gas, platinum, palladium, copper, and agricultural futures (September 3, 2026)

Huitong Network, September 3 — A chart of commodity support and resistance: Gold, Silver, Oil, Gas + Platinum, Palladium, Copper + Agricultural Futures. Updated on Thursday, September 3, 2026, at 06:45 (UTC+8). Specifically covers 14 categories, including Gold, Silver, Platinum, Palladium, Copper + Crude Oil, Natural Gas, Fuel Oil + Wheat, Corn, Cotton. For more details, refer to the special chart in the Huitong Finance Xiruo feature.
A chart of commodity support and resistance: Gold, Silver, Oil, Gas + Platinum, Palladium, Copper + Agricultural Futures. Updated on Thursday, September 3, 2026, at 06:45 (UTC+8). Specifically covers 14 categories, including Gold, Silver, Platinum, Palladium, Copper + Crude Oil, Natural Gas, Fuel Oil + Wheat, Corn, Cotton. For more details, refer to the special chart in the Huitong Finance Xiruo feature.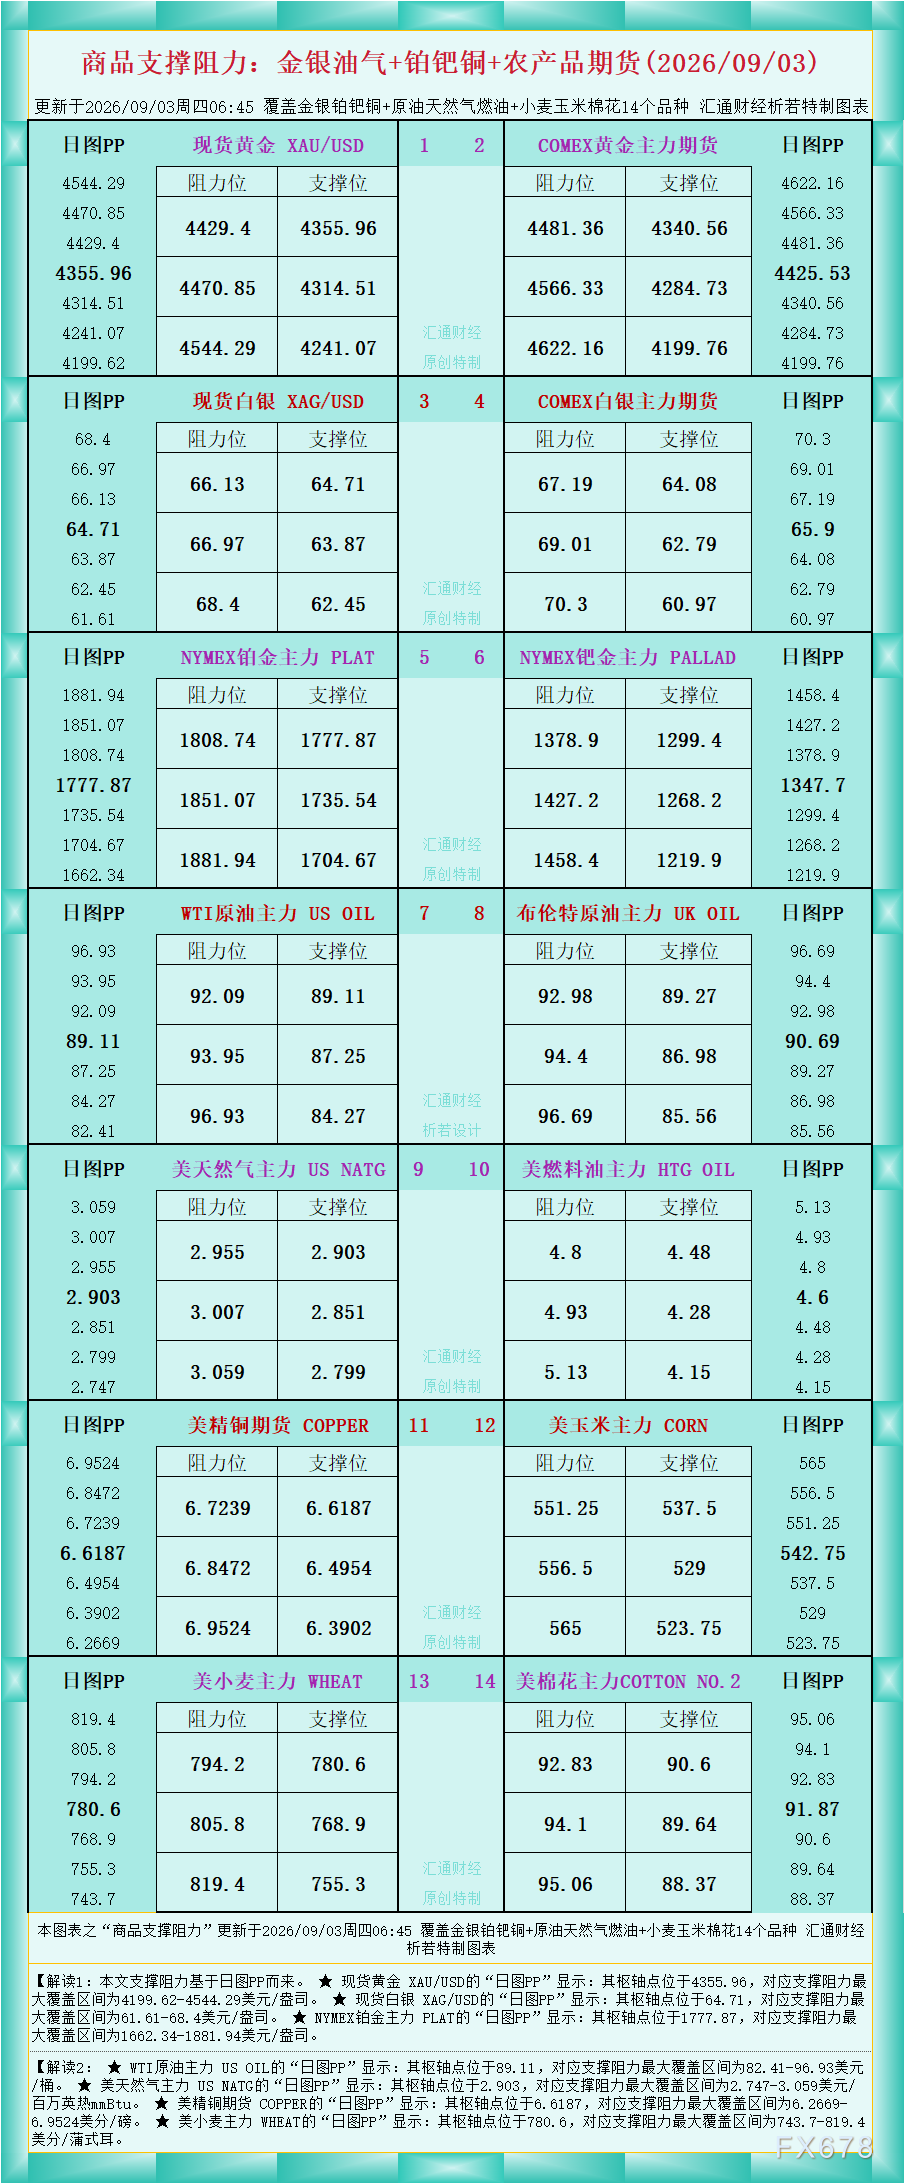
According to the chart data, Interpretation 1: The support and resistance cited in this article are based on the Daily Chart PP.
★ Spot Gold XAU/USD “Daily Chart PP” shows: Pivot point at 4355.96, with the maximum support and resistance range at $4199.62–$4544.29/ounce.
★ Spot Silver XAG/USD “Daily Chart PP” shows: Pivot point at 64.71, with the maximum support and resistance range at $61.61–$68.4/ounce.
★ NYMEX Platinum Main Contract PLAT “Daily Chart PP” shows: Pivot point at 1777.87, with the maximum support and resistance range at $1662.34–$1881.94/ounce.
Interpretation 2:
★ WTI Crude Oil Main Contract US OIL “Daily Chart PP” shows: Pivot point at 89.11, with the maximum support and resistance range at $82.41–$96.93/barrel.
★ US Natural Gas Main Contract US NATG “Daily Chart PP” shows: Pivot point at 2.903, with the maximum support and resistance range at $2.747–$3.059/mmBtu.
★ US Copper Futures COPPER “Daily Chart PP” shows: Pivot point at 6.6187, with the maximum support and resistance range at 6.2669–6.9524 cents/pound.
★ US Wheat Main Contract WHEAT “Daily Chart PP” shows: Pivot point at 780.6, with the maximum support and resistance range at 743.7–819.4 cents/bushel.
For more interpretations of other categories, see the chart.
Disclaimer: The content of this article solely reflects the author's opinion and does not represent the platform in any capacity. This article is not intended to serve as a reference for making investment decisions.
You may also like
Rapid7 director Julian Wendell Waits Sr. files initial beneficial ownership statement
Fertilizantes Heringer seeks court-backed mediation, asks for stay on creditor actions
A wave of “anti-data center” sentiment sweeps across the US, with Besent blaming cloud giants for not knowing how to win hearts and minds.
U.S. Treasury Secretary Yellen has publicly "called out" major tech giants, criticizing them for "turning a deaf ear" to community sentiment amid the explosive expansion of AI infrastructure, and rating their public relations performance only at a D-. The construction of data centers is driving up electricity and memory costs, while waves of community resistance are intensifying. Yellen's criticism of hyperscale cloud providers has extended from their debt structures to their media strategies, and the Trump administration may escalate policy pressure on AI tech giants.
Microsoft (MSFT.US) makes major changes to its financial reporting framework! Azure quarterly revenue revealed for the first time, surpassing 29 billion in a single quarter
Microsoft will begin disclosing the quarterly sales of its Azure cloud division to increase transparency. The company has provided the past two years of quarterly Azure revenue data, showing continuous growth, with the most recent quarter reaching $29.4 billion.

Crypto prices
More


